Calculus > SOLUTIONS MANUAL > Solution Manual For Applied Calculus, 7th Edition Deborah Hughes-Hallett, Andrew M. Gleason, Patti F (All)
Solution Manual For Applied Calculus, 7th Edition Deborah Hughes-Hallett, Andrew M. Gleason, Patti Frazer Lock, Daniel E. Flath Chapter 1-10 and PSA(A B C D E)
Document Content and Description Below
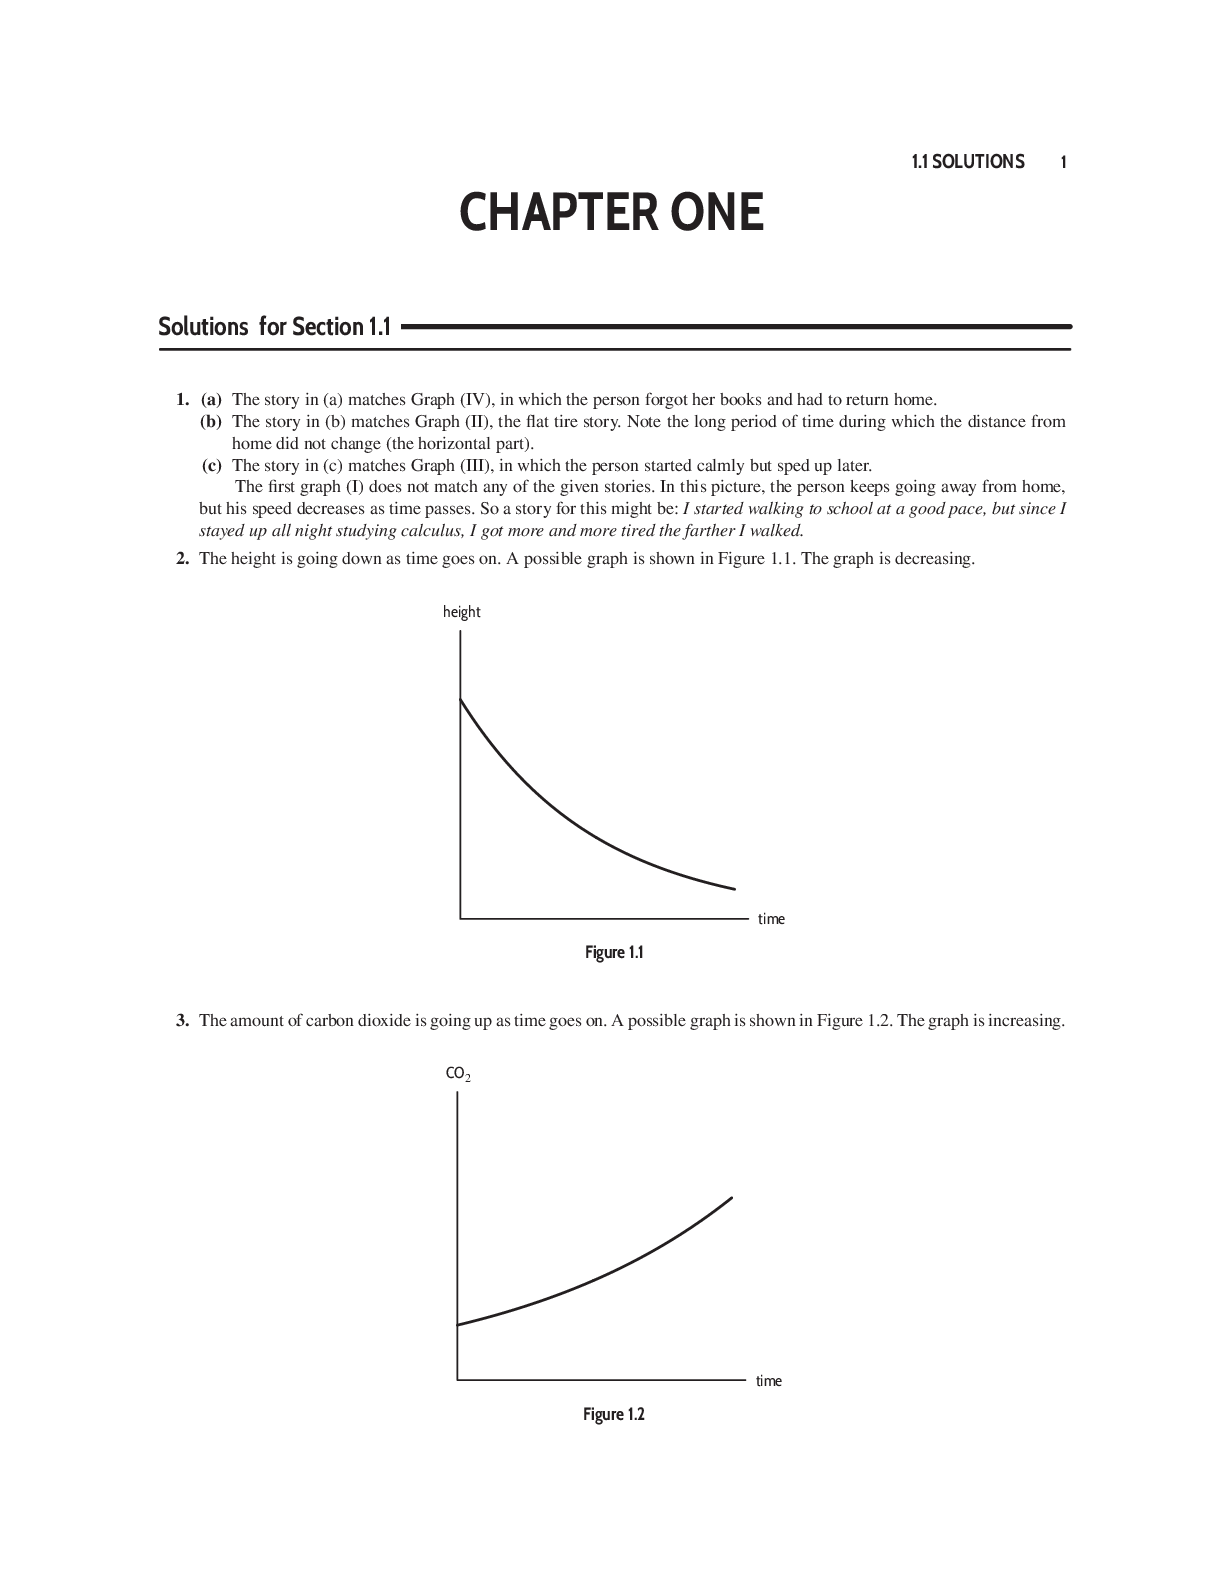
Solution Manual For Applied Calculus, 7th Edition Deborah Hughes-Hallett, Andrew M. Gleason, Patti Frazer Lock, Daniel E. Flath Chapter 1-10 and PSA(A B C D E) CHAPTER ONE Solutions for Section 1. ... 1 1. (a) The story in (a) matches Graph (IV), in which the person forgot her books and had to return home. (b) The story in (b) matches Graph (II), the fat tire story. Note the long period of time during which the distance from home did not change (the horizontal part). (c) The story in (c) matches Graph (III), in which the person started calmly but sped up later. The frst graph (I) does not match any of the given stories. In this picture, the person keeps going away from home, but his speed decreases as time passes. So a story for this might be: I started walking to school at a good pace, but since I stayed up all night studying calculus, I got more and more tired the farther I walked. 2. The height is going down as time goes on. A possible graph is shown in Figure 1.1. The graph is decreasing. height time Figure 1.1 3. The amount of carbon dioxide is going up as time goes on. A possible graph is shown in Figure 1.2. The graph is increasing. CO2 time Figure 1.2noise level distance Figure 1.4 2 Chapter One /SOLUTIONS 4. The number of air conditioning units sold is going up as temperature goes up. A possible graph is shown in Figure 1.3. The graph is increasing. AC units temperature Figure 1.3 5. The noise level is going down as distance goes up. A possible graph is shown in Figure 1.4. The graph is decreasing. 6. If we let t represent the number of years since 1900, then the population increased between t = 0 and t = 40, stayed approximately constant between t = 40 and t = 50, and decreased for t ≥ 50. Figure 1.5 shows one possible graph. Many other answers are also possible. [Show More]
Last updated: 9 months ago
Preview 1 out of 777 pages
Buy this document to get the full access instantly
Instant Download Access after purchase
Buy NowInstant download
We Accept:

Reviews( 0 )
$12.00
Can't find what you want? Try our AI powered Search
Document information
Connected school, study & course
About the document
Uploaded On
Mar 06, 2025
Number of pages
777
Written in
All

Additional information
This document has been written for:
Uploaded
Mar 06, 2025
Downloads
0
Views
58