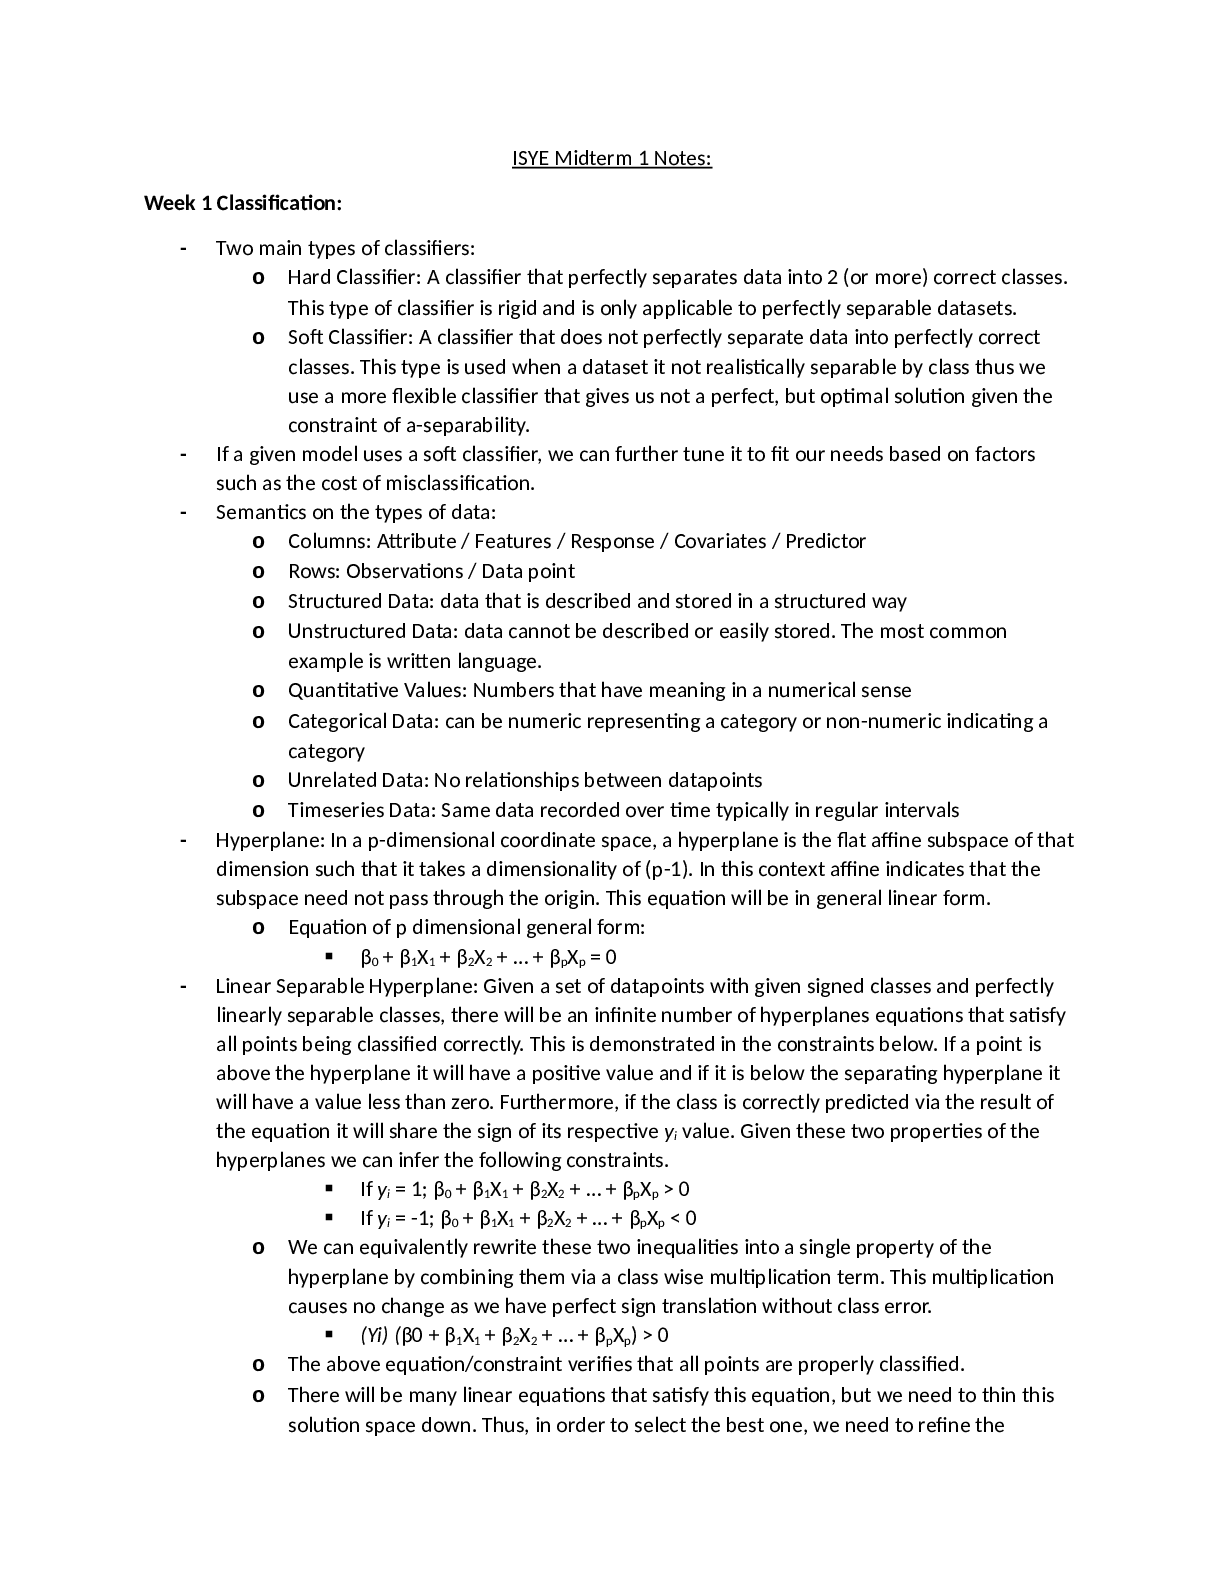
ISYE Midterm 1 Notes: Latest Updated 2022 with Complete Solution
Mechanical Engineering > Lab Report > Lab 5: Flow Rate Sensor Calibration Auburn UniversityMECH 3050MECH_3050_LAB_REPORT_05 (All)
Lab 5: Flow Rate Sensor Calibration Sangyun Go [email protected] Oct 1st, 2015 Lab section 001 1Flow Rate Sensor Calibration List of Figures Figure 1: Turbine Flow Meter (GPM) vs. Rotameter (G ... PM ) …….…….…………….3 Figure 2: Turbine Flow Meter (GPM) vs. Vortex Shedding Meter (GPM) …….…….…………….4 List of Tables Table 1: Measured values for flow sensor calibration ….……….……….……..............................1 Table 2: Interpolation Data For Turbine Flow Meter ….……….……….……..............................2 Table 3: Flow Values for Sensor Calibration ….……….……….……..............................3 Table 4: Rotameter Values for Calculations ….……….……….……..............................5 Table 5: Vortex Shedding Meter Values for Calculations ….……….……….……..............................5 Table 6: Uncertainty Values ….……….……….……..............................6 Table 7: Calibration Curve Equations ….……….……….……..............................7 23Flow Rate Sensor Calibration Abstract/Objectives Sensors always come with an uncertainty value that is rated by the manufacturer. This lab compares this rated accuracy with a calculated accuracy based off measurements that were made. Each set of data is plotted and a linear fit of the data was used to calculate the sensors calibration function. With this function, the measurements can be corrected during data analysis. Once the lab is completed, the results were tabulated and a comparison was made between the uncertainty values. Procedure In preparation for lab, the manual for lab three should be read out of the lab manual “Measurement and Instrumentation Laboratory Manual” by John F. Maddox and Jordan C. Roberts. In the lab, a rotameter, turbine flow meter, and vortex shedding meter were setup along a piping system in series. Water was drawn from a container by a centrifugal pump at a steady rate along the system. Using a valve, the flow rate was adjusted to certain percentages of maximum flow rate. These percentages were read on the rotameter. With each percentage, data was collected from each sensor. These results are shown in Table 1 [Show More]
Last updated: 3 years ago
Preview 1 out of 11 pages

Buy this document to get the full access instantly
Instant Download Access after purchase
Buy NowInstant download
We Accept:

Can't find what you want? Try our AI powered Search
Connected school, study & course
About the document
Uploaded On
Jul 02, 2021
Number of pages
11
Written in
All
This document has been written for:
Uploaded
Jul 02, 2021
Downloads
0
Views
81
Scholarfriends.com Online Platform by Browsegrades Inc. 651N South Broad St, Middletown DE. United States.
We're available through e-mail, Twitter, Facebook, and live chat.
FAQ
Questions? Leave a message!
Copyright © Scholarfriends · High quality services·


.png)


.png)