Statistics > QUESTIONS & ANSWERS > MATH 225N Week 6 Confidence Intervals Questions and answers highlighted (All)
MATH 225N Week 6 Confidence Intervals Questions and answers highlighted
Document Content and Description Below
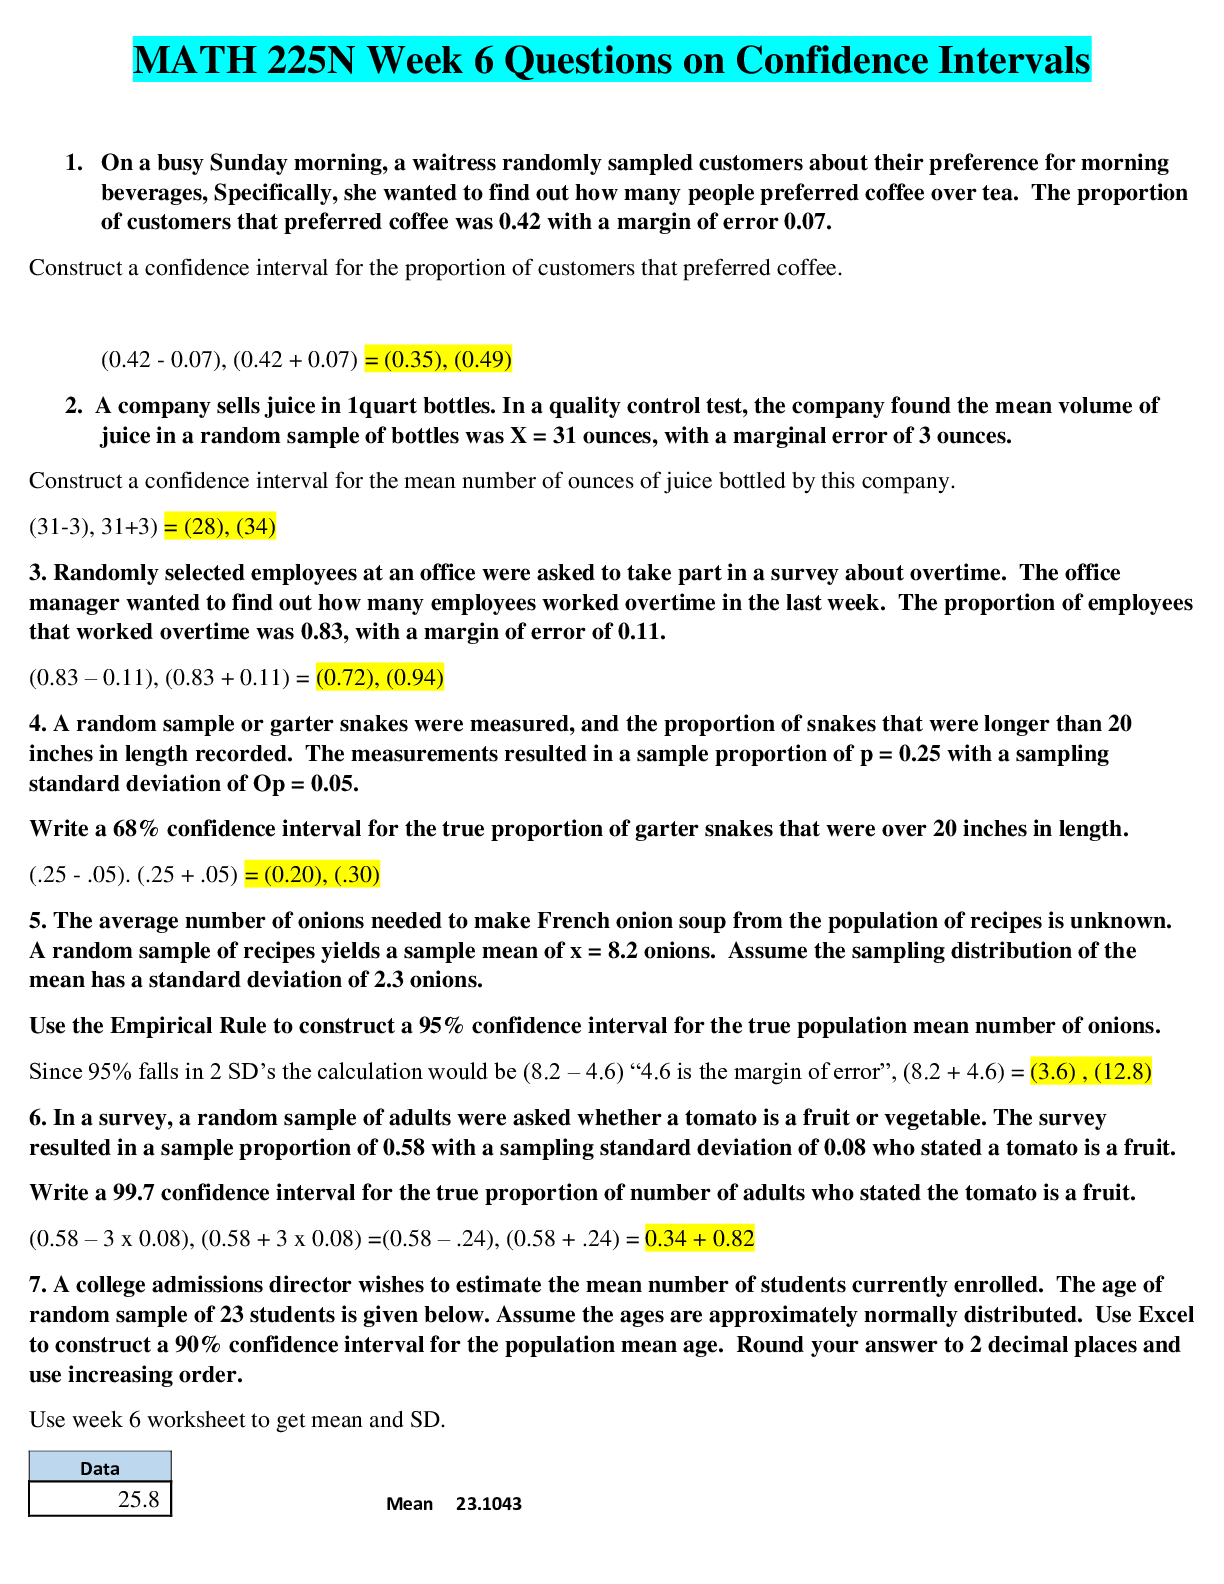
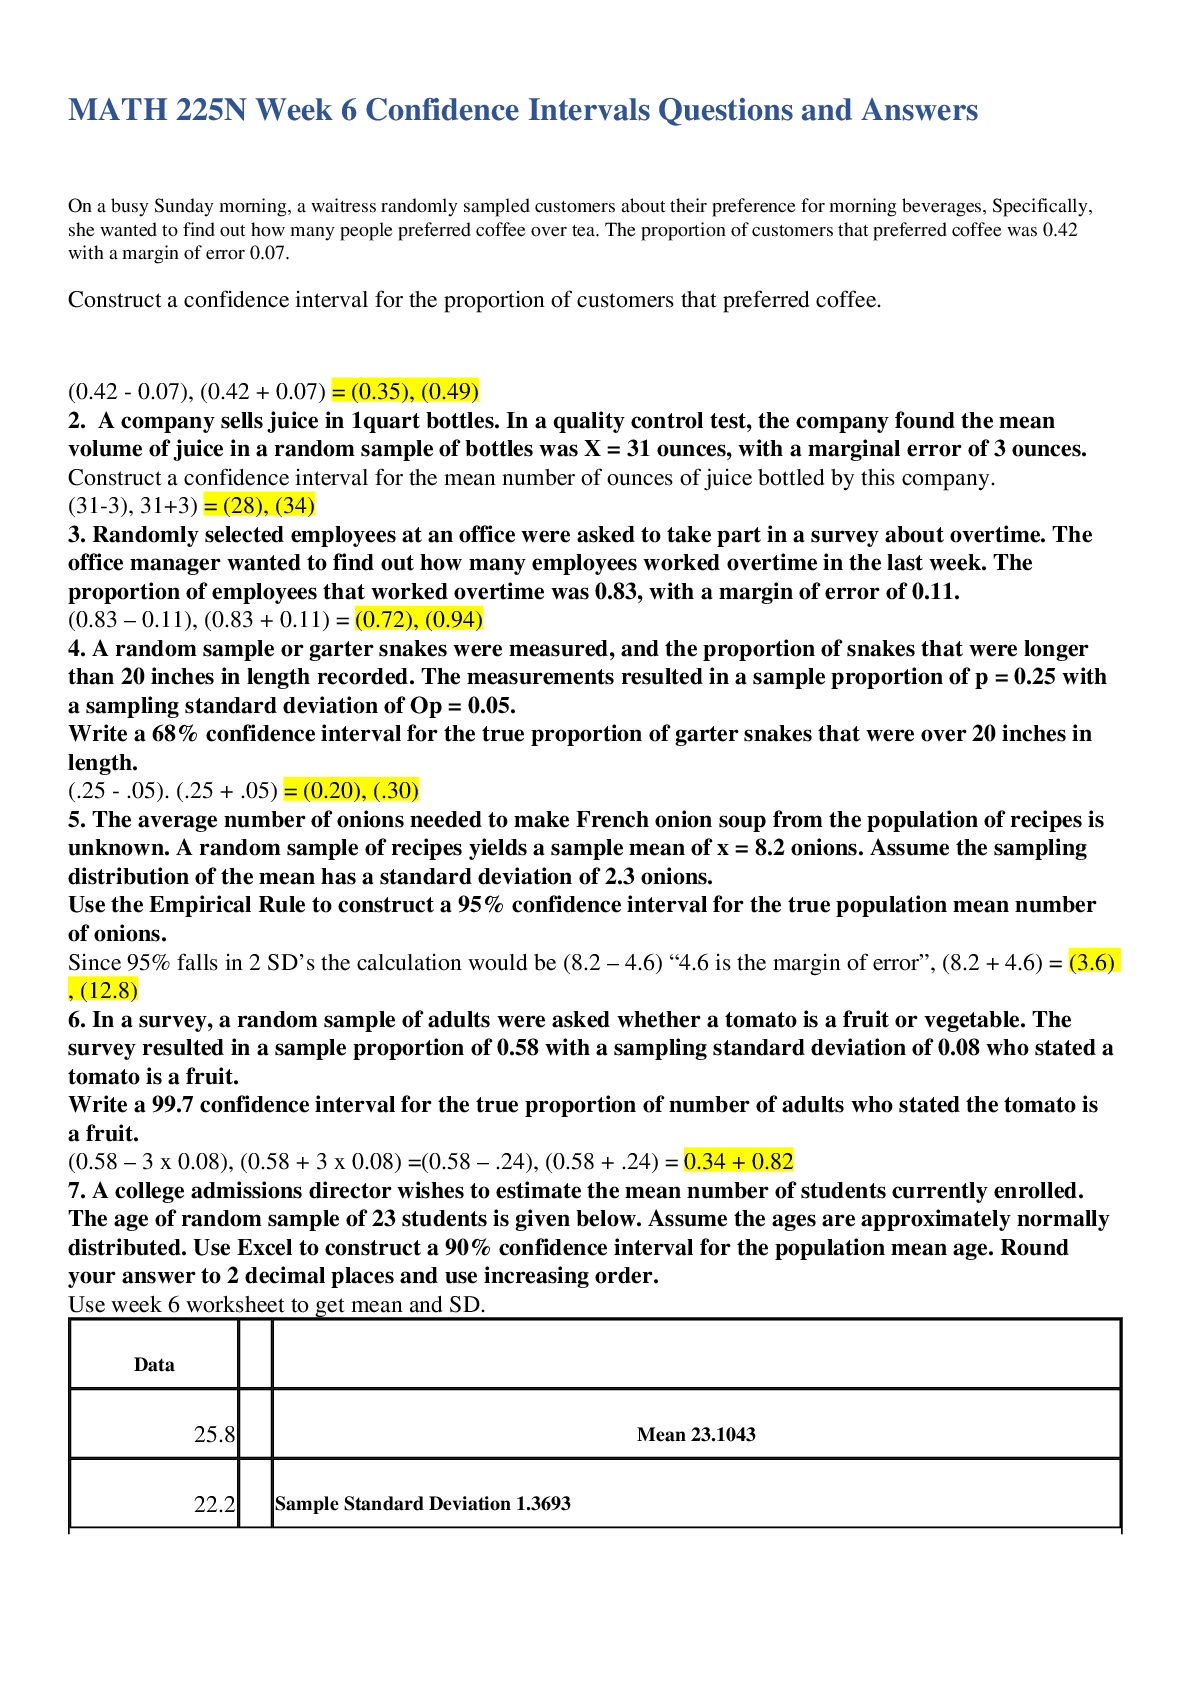
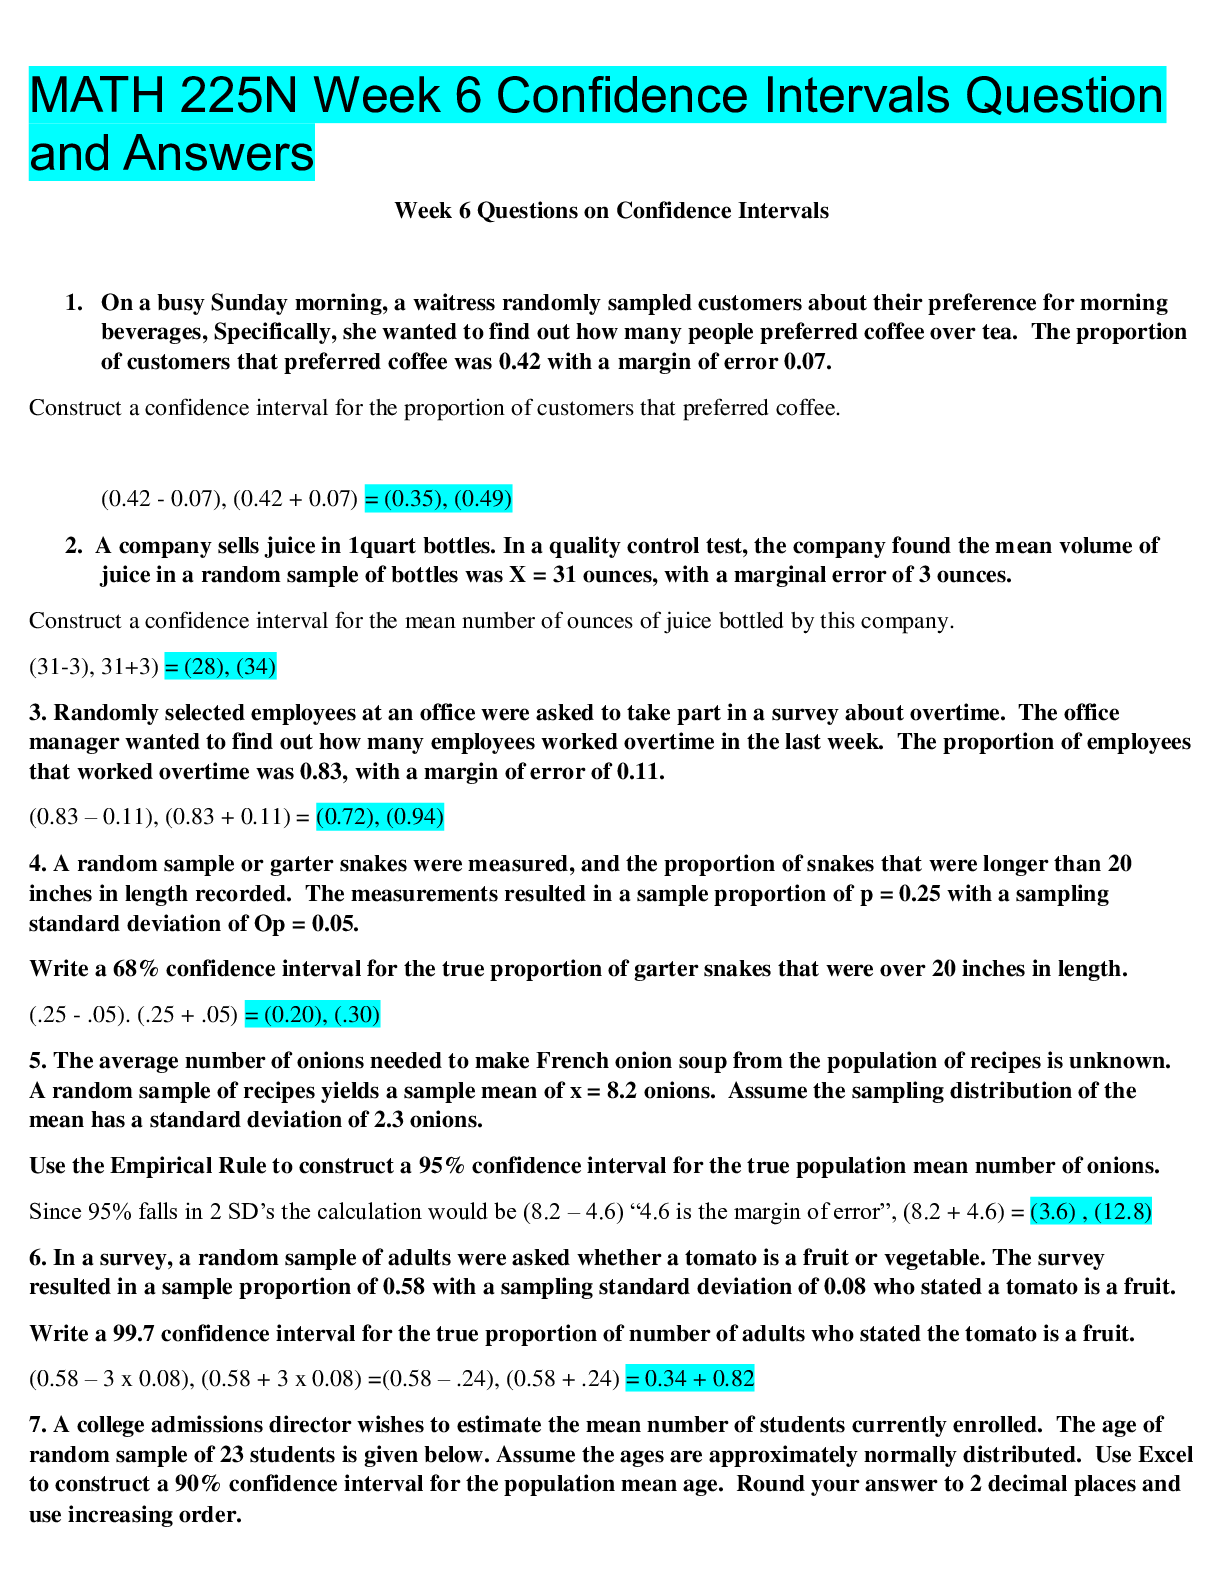
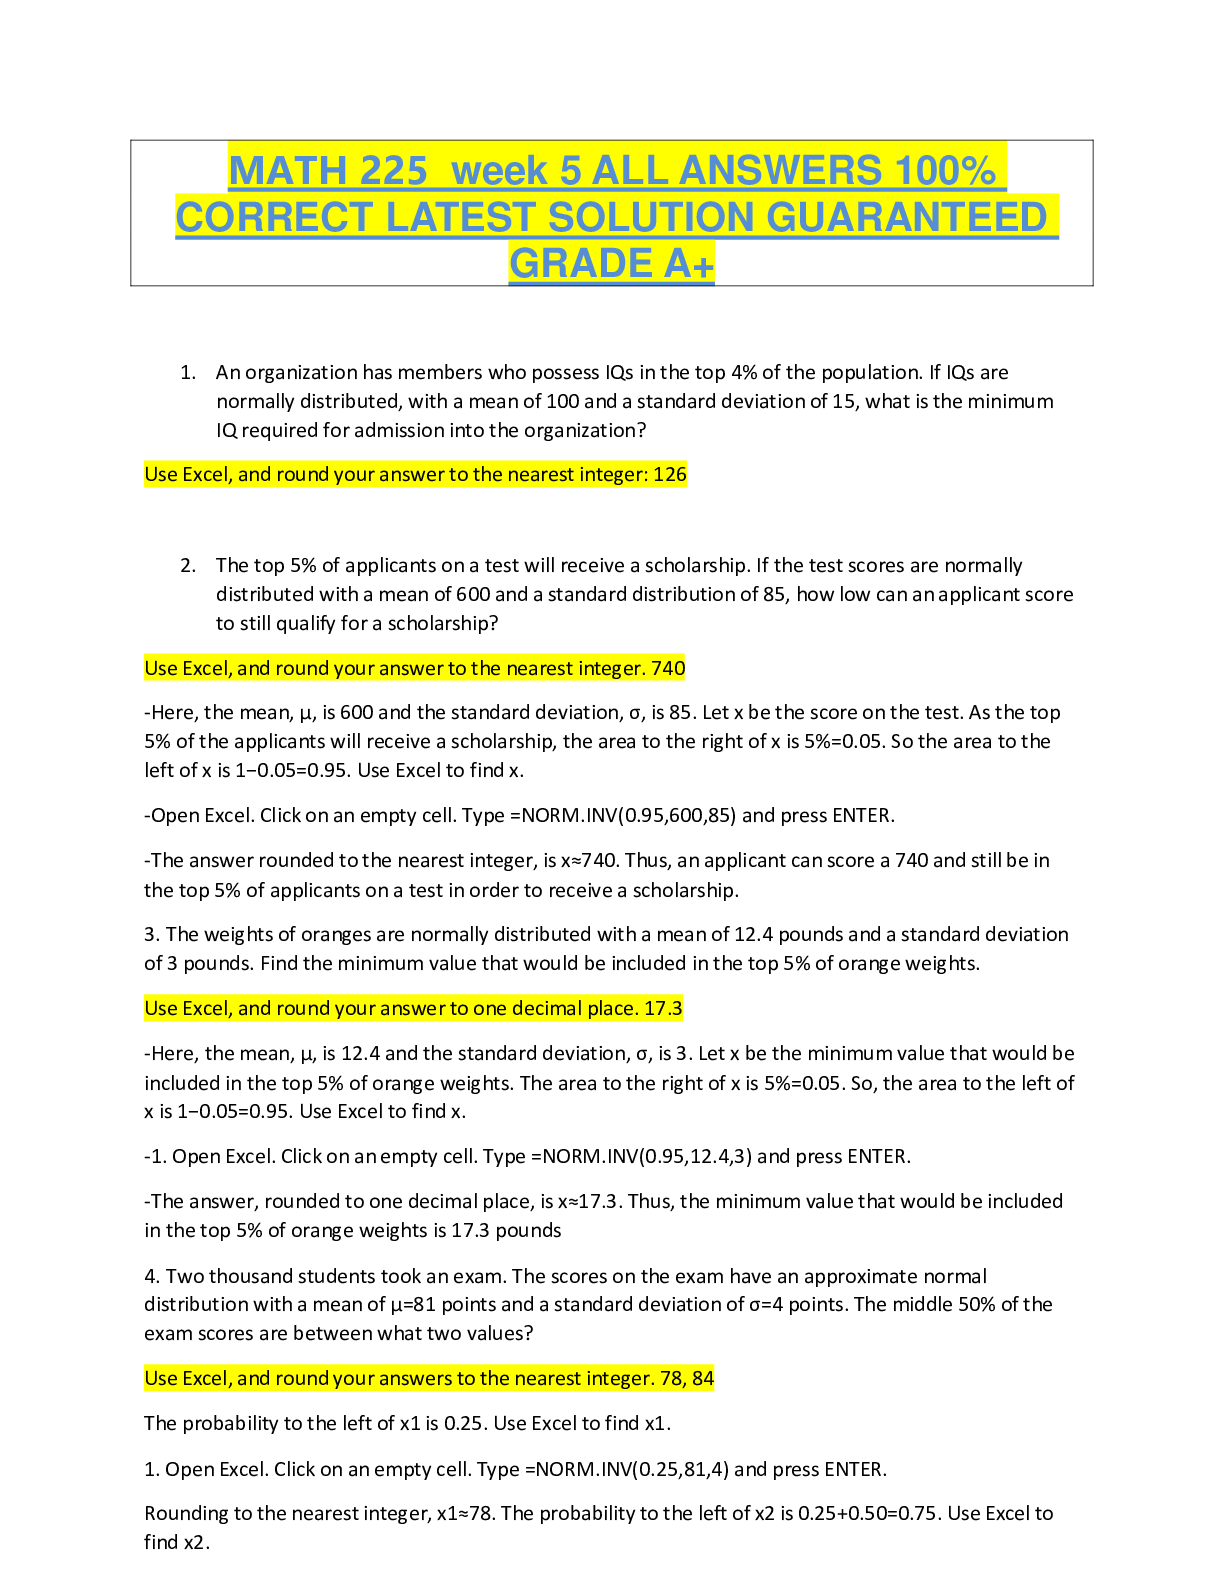
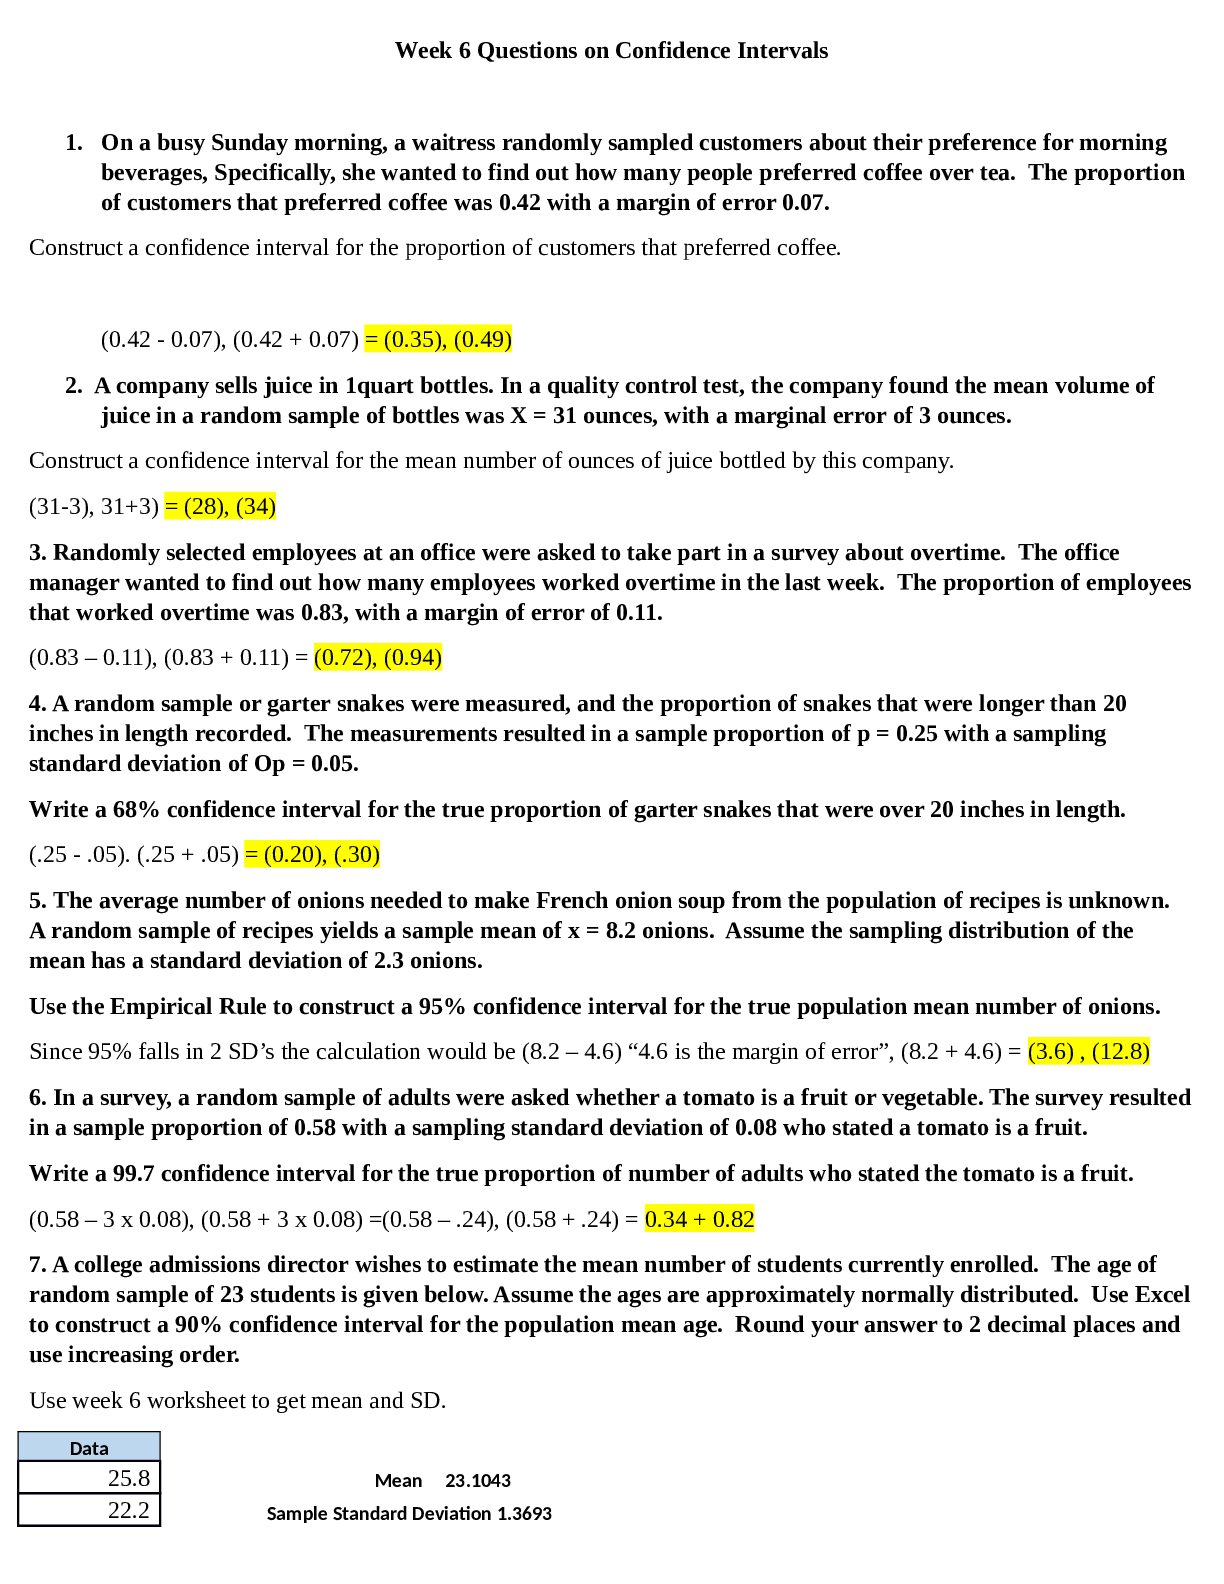
Week 6 Questions on Confidence Intervals 1. On a busy Sunday morning, a waitress randomly sampled customers about their preference for morning beverages, Specifically, she wanted to find out how man... y people preferred coffee over tea. The proportion of customers that preferred coffee was 0.42 with a margin of error 0.07. Construct a confidence interval for the proportion of customers that preferred coffee. (0.42 - 0.07), (0.42 + 0.07) = (0.35), (0.49) 2. A company sells juice in 1quart bottles. In a quality control test, the company found the mean volume of juice in a random sample of bottles was X = 31 ounces, with a marginal error of 3 ounces. Construct a confidence interval for the mean number of ounces of juice bottled by this company. (31-3), 31+3) = (28), (34) 3. Randomly selected employees at an office were asked to take part in a survey about overtime. The office manager wanted to find out how many employees worked overtime in the last week. The proportion of employees that worked overtime was 0.83, with a margin of error of 0.11. (0.83 – 0.11), (0.83 + 0.11) = (0.72), (0.94) 4. A random sample or garter snakes were measured, and the proportion of snakes that were longer than 20 inches in length recorded. The measurements resulted in a sample proportion of p = 0.25 with a sampling standard deviation of Op = 0.05. Write a 68% confidence interval for the true proportion of garter snakes that were over 20 inches in length. (.25 - .05). (.25 + .05) = (0.20), (.30) 5. The average number of onions needed to make French onion soup from the population of recipes is unknown. A random sample of recipes yields a sample mean of x = 8.2 onions. Assume the sampling distribution of the mean has a standard deviation of 2.3 onions. Use the Empirical Rule to construct a 95% confidence interval for the true population mean number of onions. Since 95% falls in 2 SD’s the calculation would be (8.2 – 4.6) “4.6 is the margin of error”, (8.2 + 4.6) = (3.6) , (12.8) 6. In a survey, a random sample of adults were asked whether a tomato is a fruit or vegetable. The survey resulted in a sample proportion of 0.58 with a sampling standard deviation of 0.08 who stated a tomato is a fruit. Write a 99.7 confidence interval for the true proportion of number of adults who stated the tomato is a fruit. (0.58 – 3 x 0.08), (0.58 + 3 x 0.08) =(0.58 – .24), (0.58 + .24) = 0.34 + 0.82 7. A college admissions director wishes to estimate the mean number of students currently enrolled. The age of random sample of 23 students is given below. Assume the ages are approximately normally distributed. Use Excel to construct a 90% confidence interval for the population mean age. Round your answer to 2 decimal places and use increasing order. [Show More]
Last updated: 2 years ago
Preview 1 out of 20 pages
Buy this document to get the full access instantly
Instant Download Access after purchase
Buy NowInstant download
We Accept:

Reviews( 0 )
$9.00
Can't find what you want? Try our AI powered Search
Document information
Connected school, study & course
About the document
Uploaded On
Aug 02, 2021
Number of pages
20
Written in

Additional information
This document has been written for:
Uploaded
Aug 02, 2021
Downloads
0
Views
83