NURSING > STUDY GUIDE > NURS 401 Lecture 7 10.14.15 (All)
NURS 401 Lecture 7 10.14.15
Document Content and Description Below
Last updated: 3 years ago
Preview 1 out of 30 pages
Instant download
.png)
Buy this Document to get the Full Access Instantly
Provided by Students Who Aced it
We Verify Document Content to Gurantee Accuracy
Reviews( 0 )
Document information
Connected school, study & course
About the document
Uploaded On
May 07, 2022
Number of pages
30
Written in
All

Additional information
This document has been written for:
Uploaded
May 07, 2022
Downloads
0
Views
105
Document Keyword Tags
Recommended For You
Get more on STUDY GUIDE »
Conversation Concept Lab Results | Turned In Health Assessment...

NURS 4010 Exam Questions and Answers (verified 2019/2020) ver...
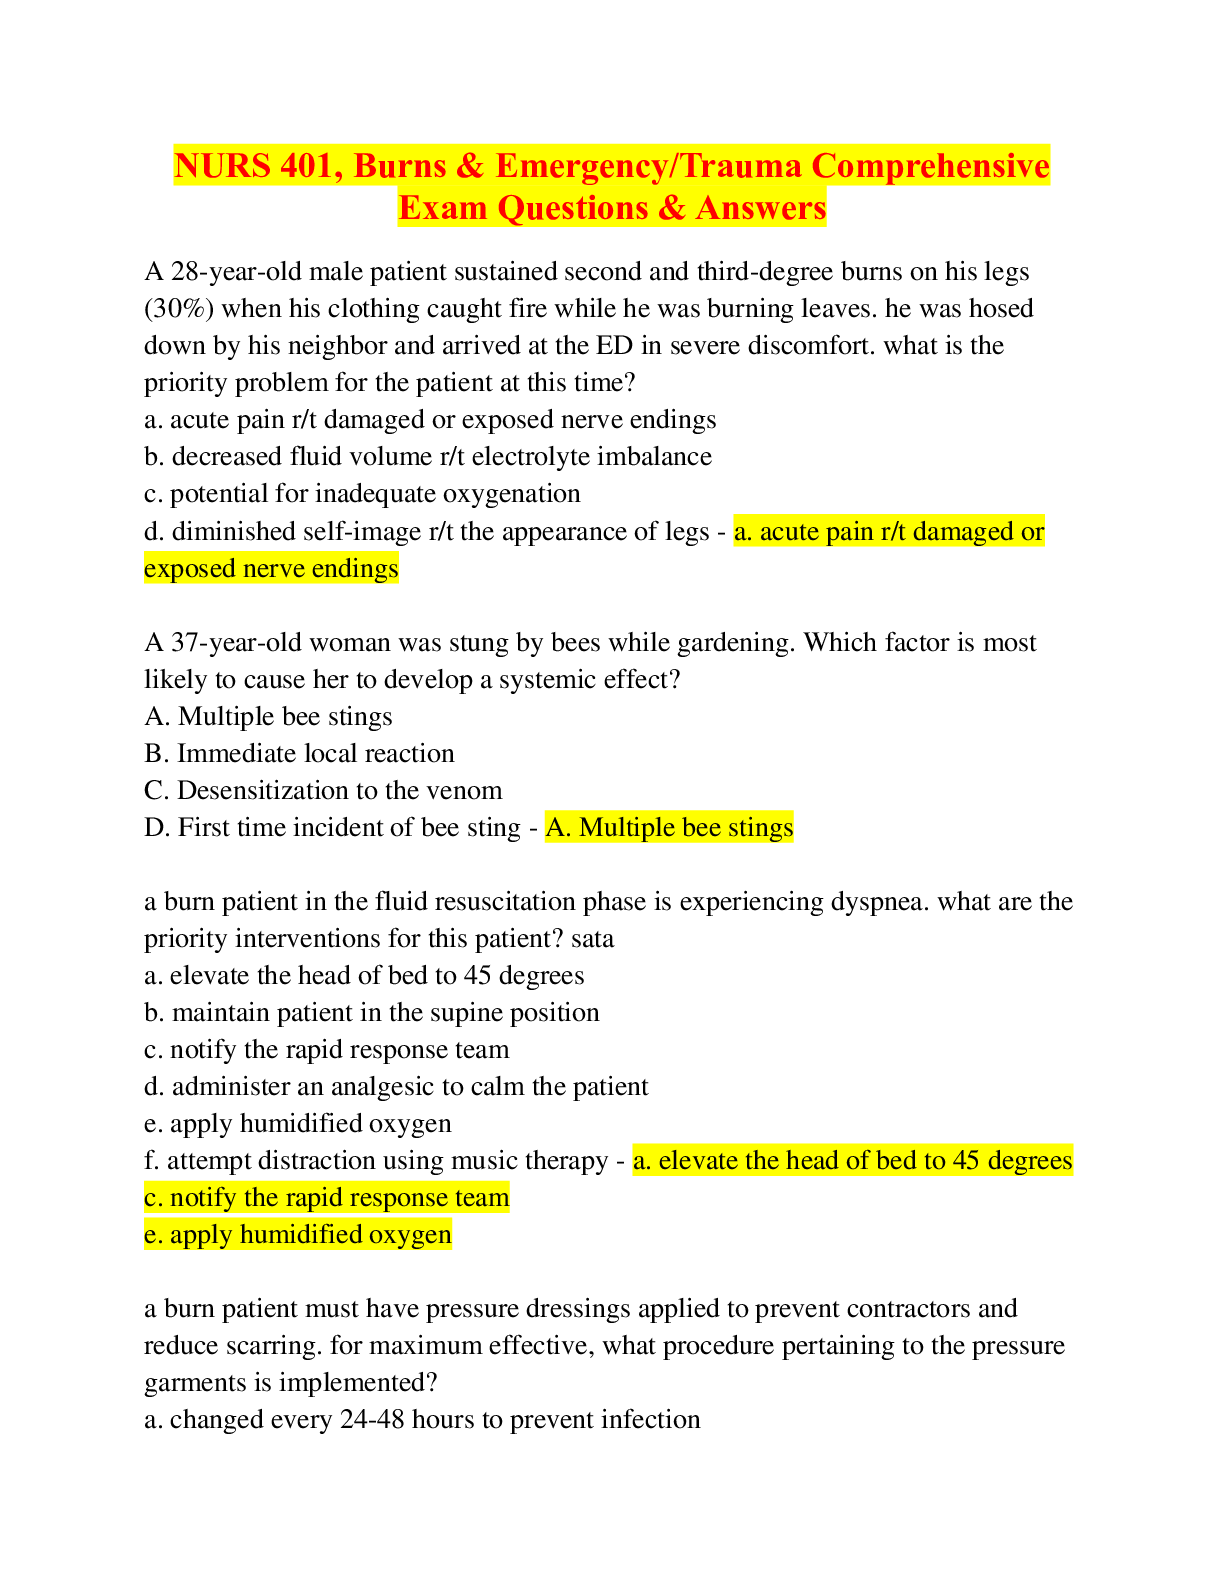
NURS 401, Burns & Emergency/Trauma Comprehensive Exam Question...

 (1).png)
Nurs 4010 cat version 1 latest 2020 east Carolina university n...

NURS 401-Renal ATI exam -with 100|% verified answers-2022

TEST BANK for Davis Advantage for Psychiatric Mental Health Nu...

CHIM NCE Health Information Management Practice Exam 1 – Ver...
Test Bank For Fundamentals of Nursing 11th Edition Potter Perr...
TEST BANK for Essentials of Psychiatric Mental Health Nursing:...
Essentials of Psychiatric Nursing 2nd Edition Boyd TEST BANK