Statistics > EXAM REVIEW > Questions and Answers > Capella University PSYC 4700. Statistics for Psychology. Week 2: Frequency D (All)
Questions and Answers > Capella University PSYC 4700. Statistics for Psychology. Week 2: Frequency Distributions, Percentiles, and Graphical Representations
Document Content and Description Below
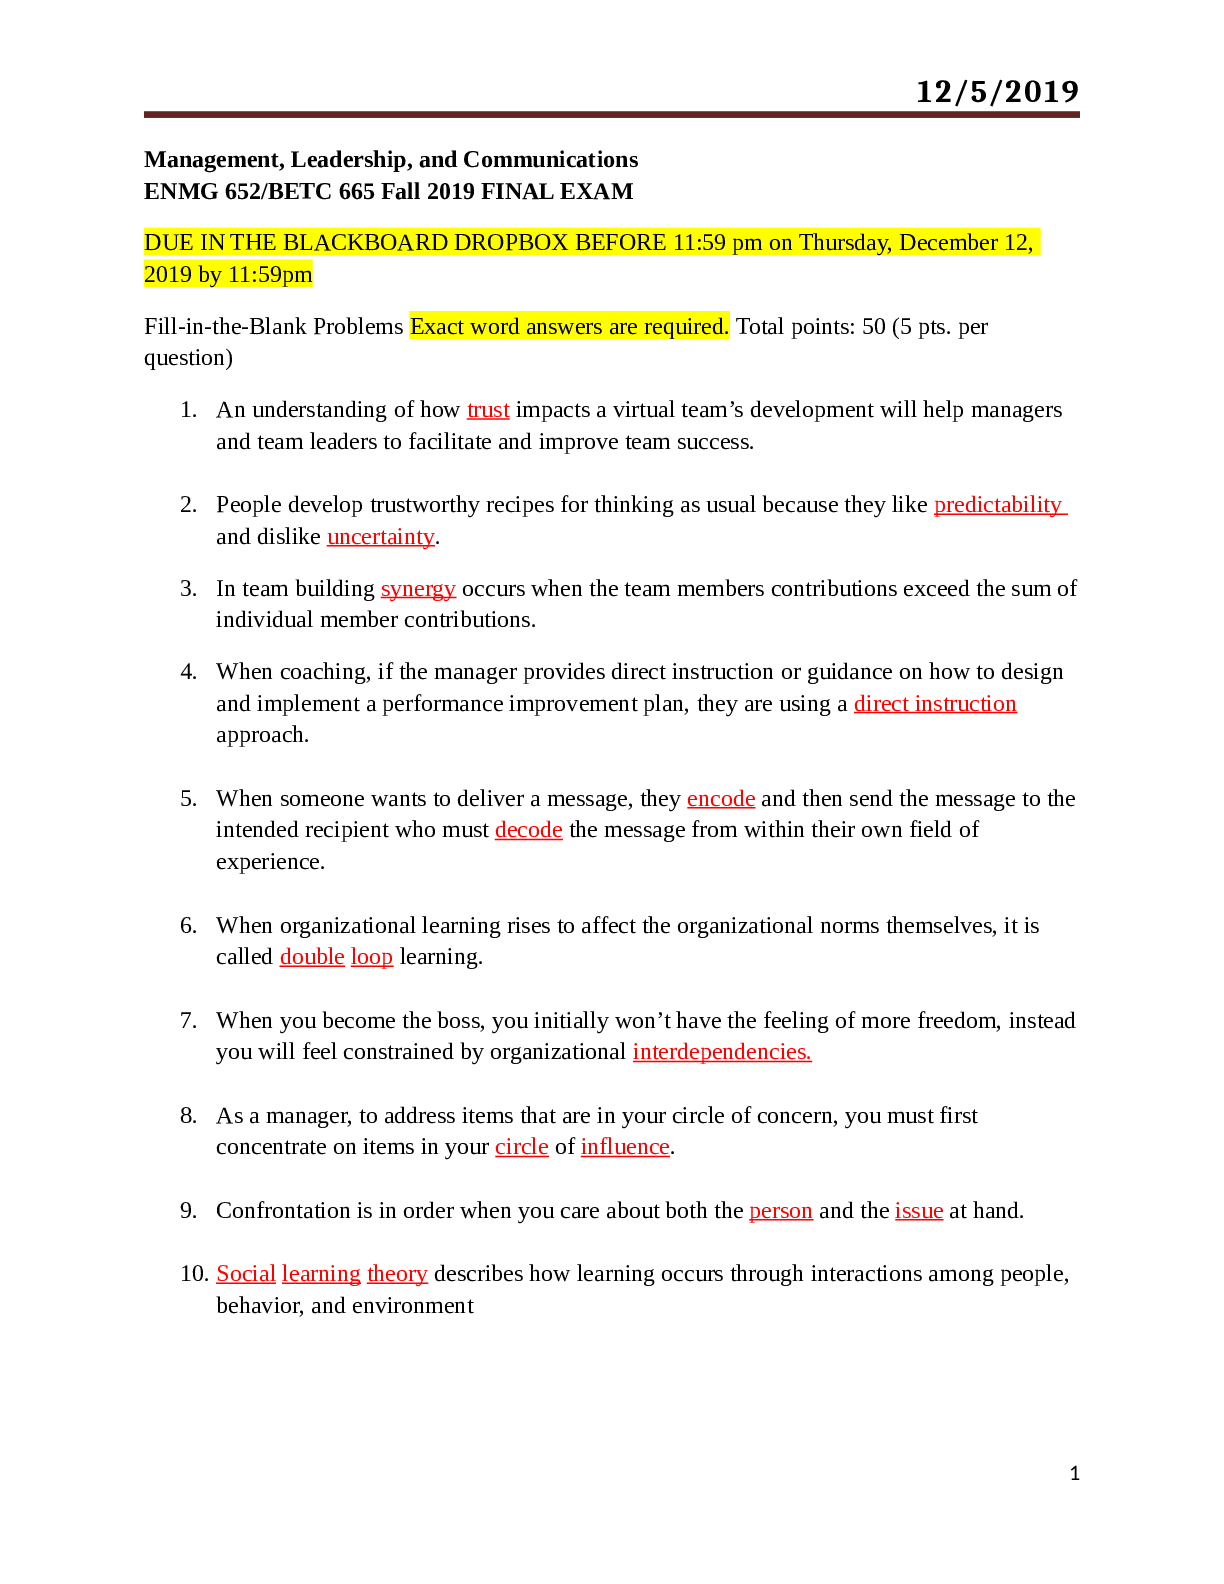
Capella University PSYC 4700 Week 2: Frequency Distributions, Percentiles, and Graphical Representations PSYC4700 - Statistics for the Behavioral Sciences Week 2: Frequency Distributions, Percent... iles, and Graphical Representations Complete the following problems within the Word document. (Do not submit other files.) Show your work for problem sets that require calculations. Ensure your answer to each problem is clearly visible. (You may want to highlight your answer or use a different font color to set it apart.) Submit the document to your instructor by Sunday, 11:59 p.m. central time. Problem Set 2.1: Grouped or Ungrouped Criterion: Explain the identification of types of data. Instructions: Fill in the table below. For each example, state whether it is grouped or ungrouped and why Problem Set 2.2: Frequencies and Percent Criterion: Identify frequencies and percent. Instructions: State whether a cumulative frequency, relative frequency, relative percent, cumulative relative frequency, or cumulative percent is most appropriate for describing the following situations. For cumulative distributions, indicate whether these should be summarized from the top down or from the bottom up. Data: 1. The frequency of businesses with at least 20 employees: is summarized from bottom up cumulative frequency distribution. 2. The frequency of college students with less than a 3.0 GPA: cumulative frequency distribution, it would be summarized from top down 3. The percentage of women completing 1, 2, 3, or 4 tasks simultaneously: a relative percent 4. The proportion of pregnancies performed in public or private hospitals: This would be relative frequency 5. The percentage of alcoholics with more than 2 years of substance abuse: cumulative percent Problem Set 2.3: Reading a Chart Criterion: Locate data on a chart. Problem Set 2.2: Frequencies and Percent Criterion: Identify frequencies and percent. Instructions: State whether a cumulative frequency, relative frequency, relative percent, cumulative relative frequency, or cumulative percent is most appropriate for describing the following situations. For cumulative distributions, indicate whether these should be summarized from the top down or from the bottom up. Data: 1. The frequency of businesses with at least 20 employees: is summarized from bottom up cumulative frequency distribution. 2. The frequency of college students with less than a 3.0 GPA: cumulative frequency distribution, it would be summarized from top down 3. The percentage of women completing 1, 2, 3, or 4 tasks simultaneously: a relative percent 4. The proportion of pregnancies performed in public or private hospitals: This would be relative frequency 5. The percentage of alcoholics with more than 2 years of substance abuse: cumulative percent Problem Set 2.3: Reading a Chart Criterion: Locate data on a chart. Problem Set 2.6: Construct a Bar Graph in SPSS Criterion: Construct a bar graph in SPSS. Instructions: The Clicks data from Problem Set 2.5 is discrete. Complete the following steps to create a bar chart to examine the data: 1. Go back to your SPSS Statistics Data Editor where your Clicks data should be displayed. 2. In the Toolbar, click Graphs, select Legacy Dialogs, and then select Bar. 3. Click Simple, then select Define. Select Clicks and then click Arrow to send it over to the Category Axis box. 4. Click OK. Copy and paste the bar graph below. (Hint: You might need to use Copy Special and click the .jpeg option.) 5. Optional to answer: What is the shape of the distribution? Problem Set 2.7: Construct a Pie Chart in SPSS Criterion: Construct a pie chart in SPSS. Instructions: Complete the following steps to create a pie chart to examine the Clicks data from Problem Set 2.5. 1. Go back to your SPSS Statistics Data Editor where your Clicks data should be displayed. 2. Select Data View, click Graphs, select Legacy Dialogs, and then select Pie. 3. Click Summaries for groups of case and then select Define. Select Clicks and then click Arrow to send it over to the Define Slices By box. 4. Click OK. Copy and paste the pie graph below. Problem Set 2.8: GSS Variables Criterion: Choose variables for a study. Instructions: Follow the directions, step by step, below. a. Go to GSS Data Explorer. Click Register on the top right corner and sign up. You do not need to use your Capella email address. It may take a minute or two to register. Confirm your registration. You’ll receive a separate email with these instructions. b. After you have registered, go to MyGSS and follow the steps below. Select Create project. c. Label Project 4700_Last Name, then click Create Project. d. Select Public to make your data available to the public. Click Continue. e. Make sure there is a check beside Excel Workbook (data + metadata) and SPSS Control File. f. Click Search Variables. The button is on the right hand side of the screen. g. In the search box, type in the name or code of your first variable. When you find it, click on it. h. Copy and paste the screen shot of information on it below. [Show More]
Last updated: 2 years ago
Preview 1 out of 8 pages

Buy this document to get the full access instantly
Instant Download Access after purchase
Buy NowInstant download
We Accept:

Reviews( 0 )
$8.00
Can't find what you want? Try our AI powered Search
Document information
Connected school, study & course
About the document
Uploaded On
Aug 24, 2022
Number of pages
8
Written in
Additional information
This document has been written for:
Uploaded
Aug 24, 2022
Downloads
0
Views
70






 (1).png)
