Biomedical > Report > BME 210 Biomedical Computer Simulation Methods Homework 5: Spread of Disease (All)
BME 210 Biomedical Computer Simulation Methods Homework 5: Spread of Disease
Document Content and Description Below
Last updated: 3 months ago
Preview 4 out of 12 pages
Instant download

Loading document previews ...
Buy this Document to get the Full Access Instantly
Provided by Students Who Aced it
We Verify Document Content to Gurantee Accuracy
Reviews( 0 )
Document information
Connected school, study & course
About the document
Uploaded On
Apr 18, 2026
Number of pages
12
Written in
All

Additional information
This document has been written for:
Uploaded
Apr 18, 2026
Downloads
0
Views
54
Document Keyword Tags
Recommended For You
Get more on Report »


Principles of Economics, 13e Karl Case, Ray Fair, Sharon Oster...


University of Maryland, University College CMIT 350 Cisco Netw...

University of Maryland, University College CMIT 350 Cisco Netw...
[ Review the models of stewardship presented by Wilson (2016)...

NR 509 Week 1 Health History. T.J SOAP Note Template-All Fille...
First Community Bank Statement - Operating Account (January 20...
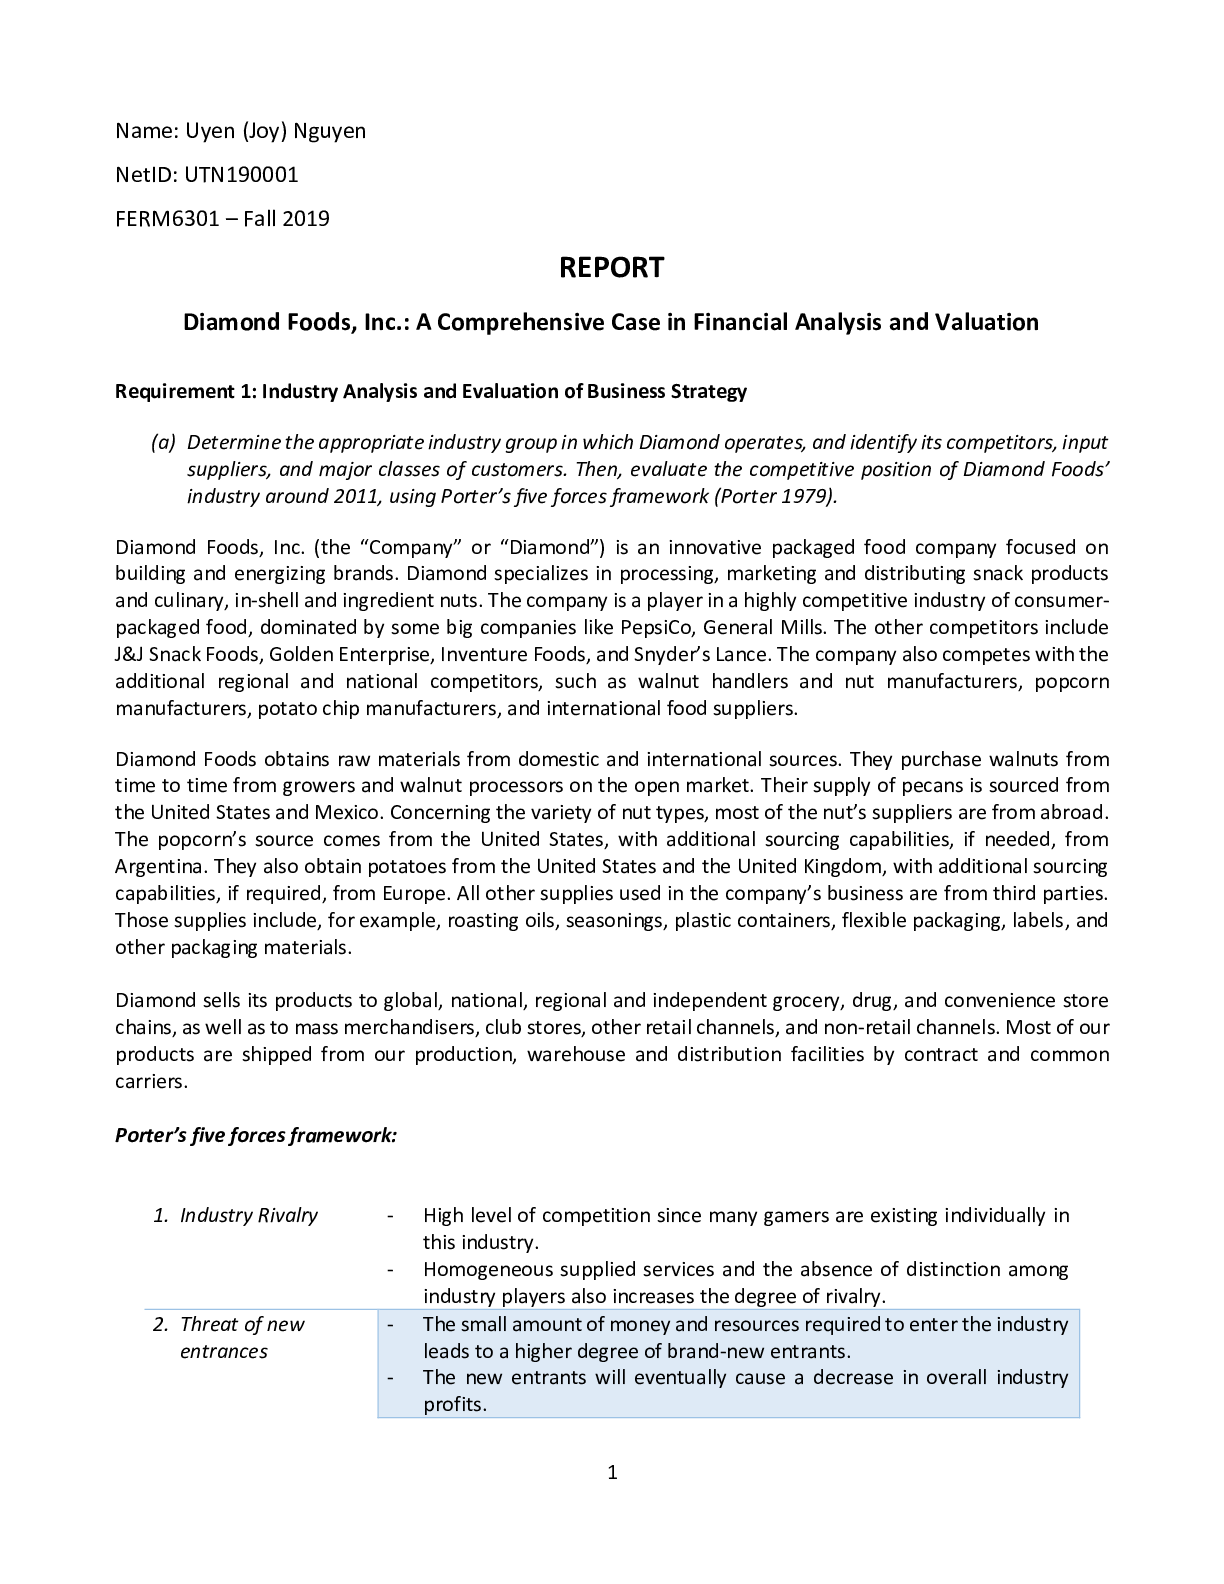
REPORT Diamond Foods, Inc.: A Comprehensive Case in Financial...

Student Weekly Work Virtual Lab Experience Self-Reflective Lea...