Report for Experiment #13
Simple Harmonic Motion
Kaleigh Schnell
Lab Partner: Jasmin Wilson
TA: Kunpeng Mu
September 20, 2016
Abstract
Simple Harmonic Motion is an everyday part of life that is not usually thought
...
Report for Experiment #13
Simple Harmonic Motion
Kaleigh Schnell
Lab Partner: Jasmin Wilson
TA: Kunpeng Mu
September 20, 2016
Abstract
Simple Harmonic Motion is an everyday part of life that is not usually thought about in much
detail. Simple Harmonic Motion is defined to be the motion of a mass on a spring when it is
subject to the linear elastic restoring force given by Hooke's Law. The motion is sinusoidal in
time and demonstrates a single resonant frequency. This lab looks at this definition and Newton’s
Second Law which states an object is said to be in equilibrium when the sum of all forces acting
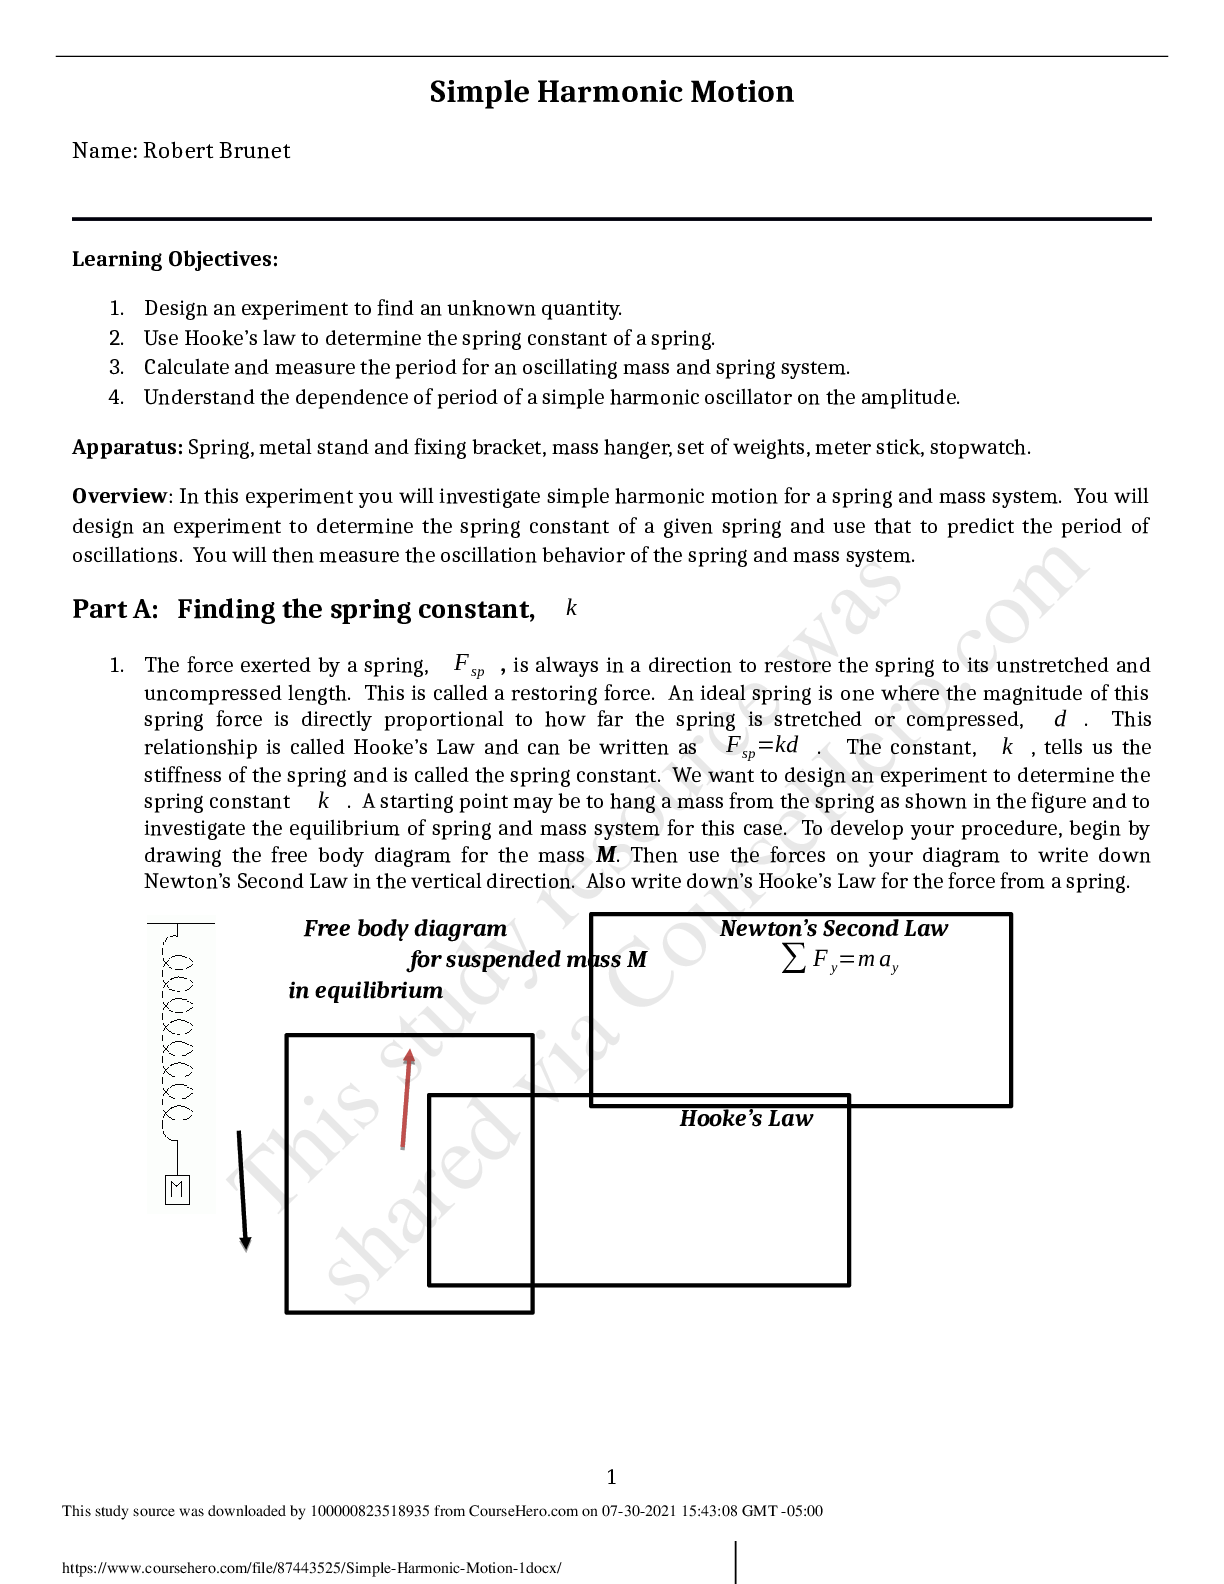
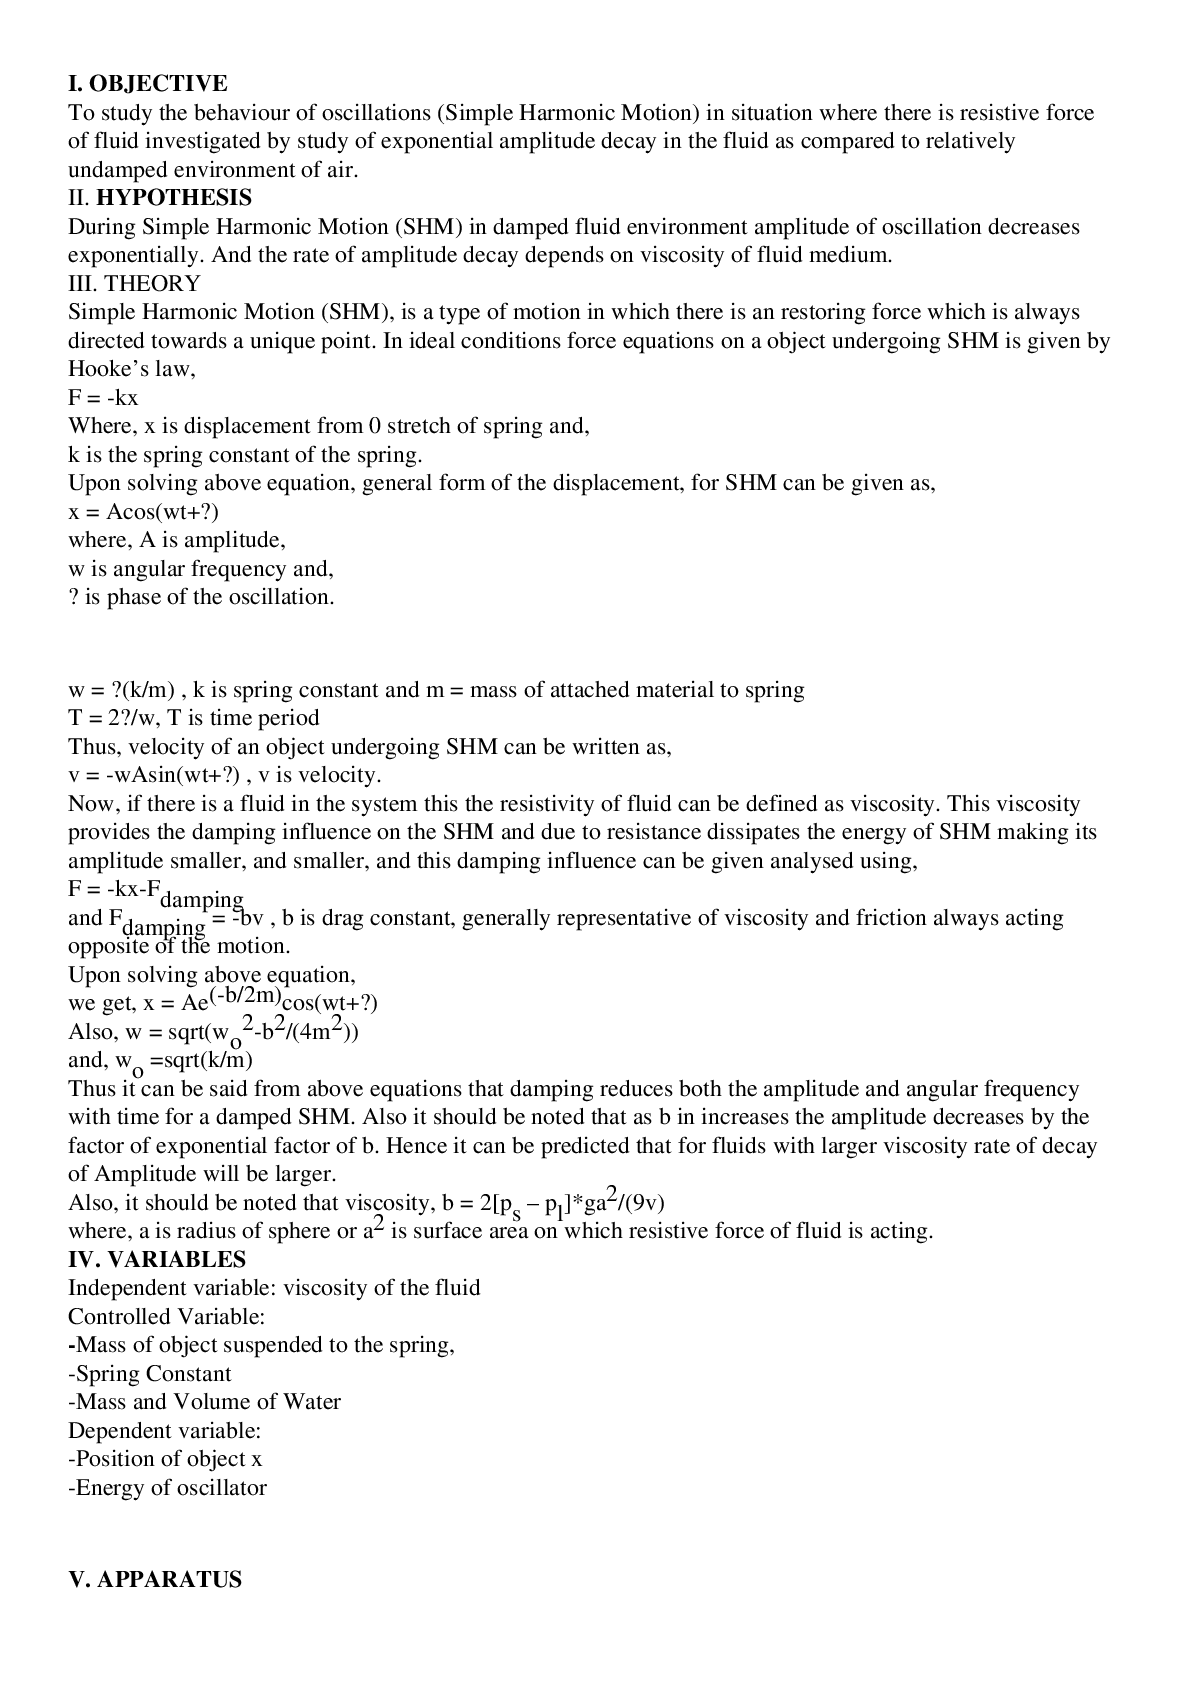
on it add up to zero or no force means no acceleration.Introduction
This experiment studies oscillations of a glider on an air track, held by a spring on each side. The
point of the lab is to understand characteristics of oscillating motion: amplitude, period,
frequency, and phase and to explore harmonic motion that includes damping forces. There are
two investigations in this lab, the first Investigation looks at the basic apparatus of a glider on an
air track attached to the ends of the track by two springs. The experimenters are to determine the
amplitude A, the period T, the phase ø, and the spring constant k. The materials needed are an air
track with glider, two 7.4 cm long springs, computer, PASCO PASPort USB Link and Motion
Sensor, and six ring magnets. The second Investigation focusses more on damped harmonic
motion. This is looking at the effects of friction on harmonic motion. The friction in this lab is
caused by electromagnetic force which is generated by ring magnets placed on the glider. The
magnets moving along the track induce currents which transfer energy to the track and slow the
glider down.
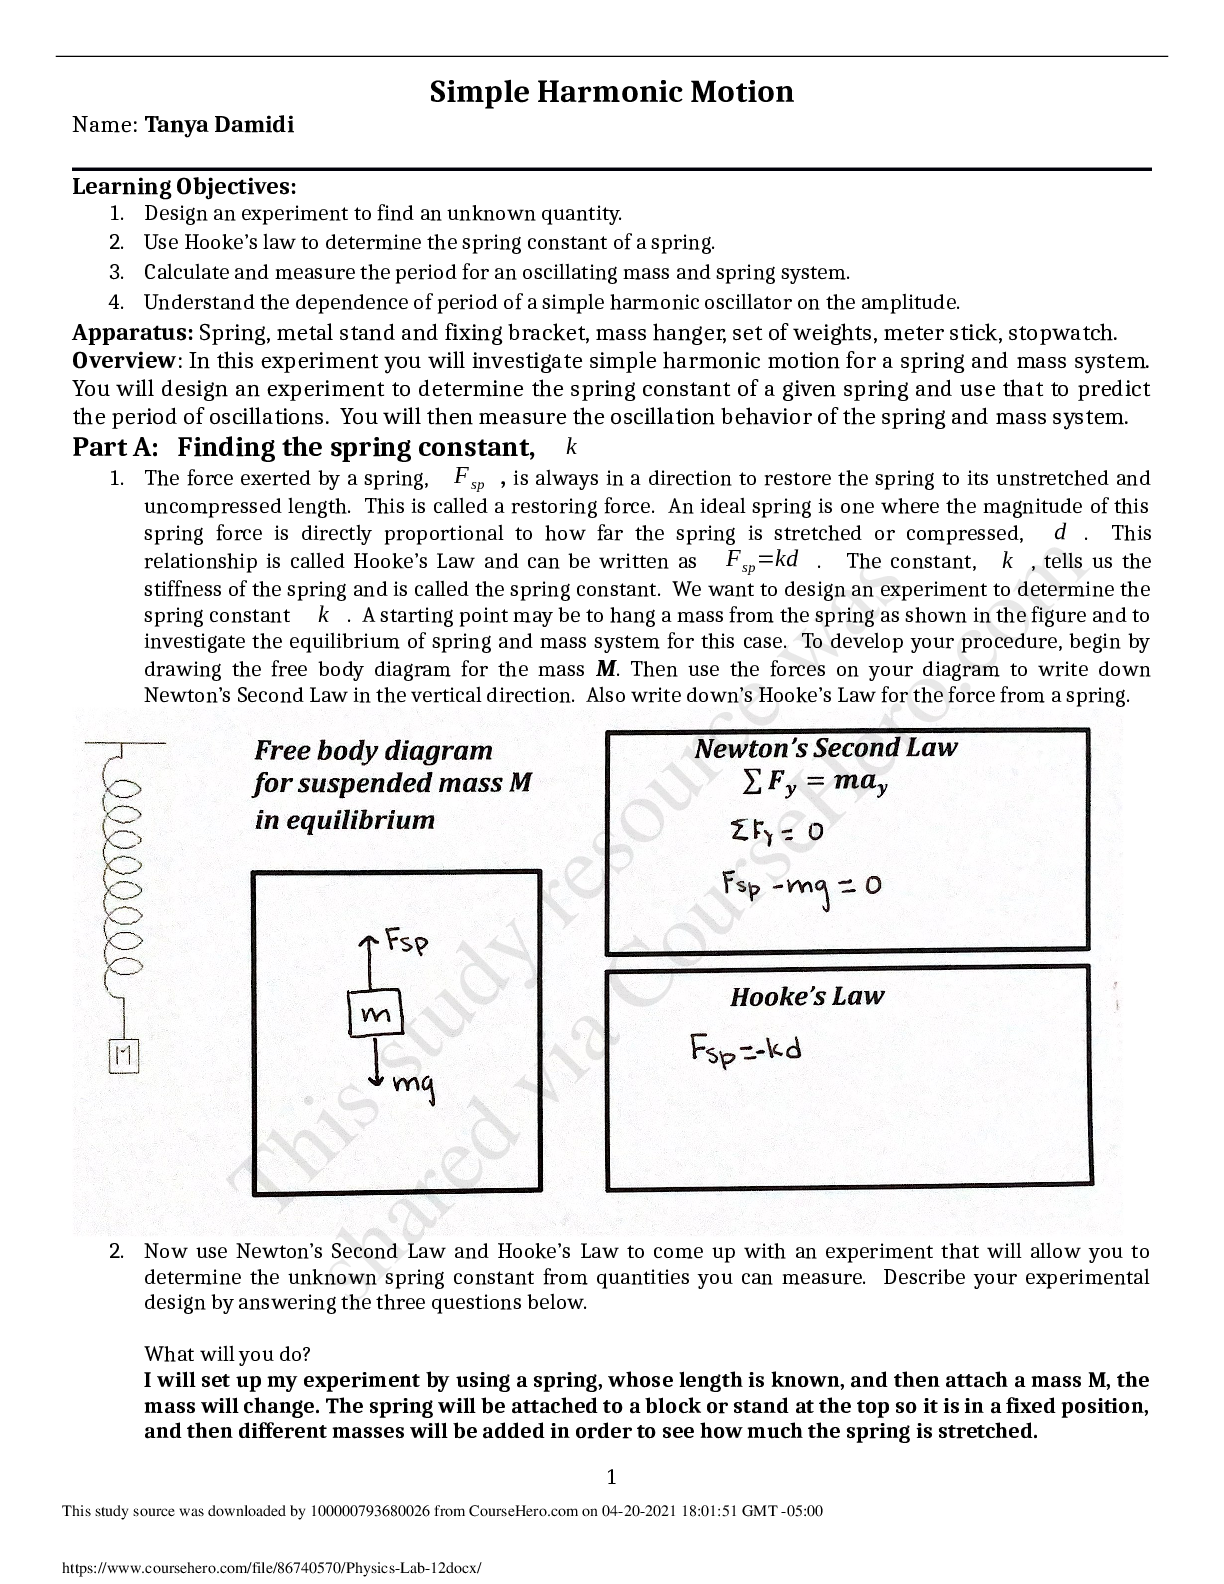
Investigation 1
Setup & Procedure
Gather all the materials needed for Investigation 1 and record the mass of the glider. Turn the air
source on for the glider and level the track so that the glider does not move when placed in the
middle of the track. Connect the PASPort USB link into the computer and make sure the USB
blue link box is connected to the PASPort motion sensor. On the computer open PASCO
Capstone and setup, the table and graph. The measurements should say Position (m) and Time
(s). Set the x and y labels of the graph to reflect these measurements. Fasten the motion sensor to
the vertical rod and adjust the height until it is located just above the center of the gliders
reflector. Rotate the motion sensor until its gold covered surface is parallel with the reflector of
the glider. The tilt angle should be at 90 degrees. Set the motions sensors default sample rate to
20 Hz. Put the two 7.5 cm springs on the glider and connect it to the track, turn the air track on
so that it is moving freely back and forth. Record this information in the position vs time graph
set up. Bring this data into a spreadsheet to use in the analysis. Set the glider at 40 cm mark,
release and record. Copy this data into the spreadsheet.
Estimate the values of the amplitude, period, and phase and record. Find the equilibrium position
xo by averaging the equilibrium position data then subtract the equilibrium position from the
oscillating glider position data to obtain the centered positions. Plot this data in a centered
position vs time graph. Find the amplitude of the first peak and compare it to the estimated value.
Find the period T by using the measured times from the first six peaks. Do this by plotting the
time coordinate for the six peaks versus the peak number. Find the slope and explain why the
slope is the average period. Use the period to obtain the frequency and angular frequency. Next
find the phase by looking at the plot produced from the oscillating glider (centered position vstime). Find the theoretical spring constant k of the two springs jointly acting on the glider then
compare it to the k found using the equation ω = √ k÷ m . Where m is the mass. The
values for k should be within ten percent of each other.
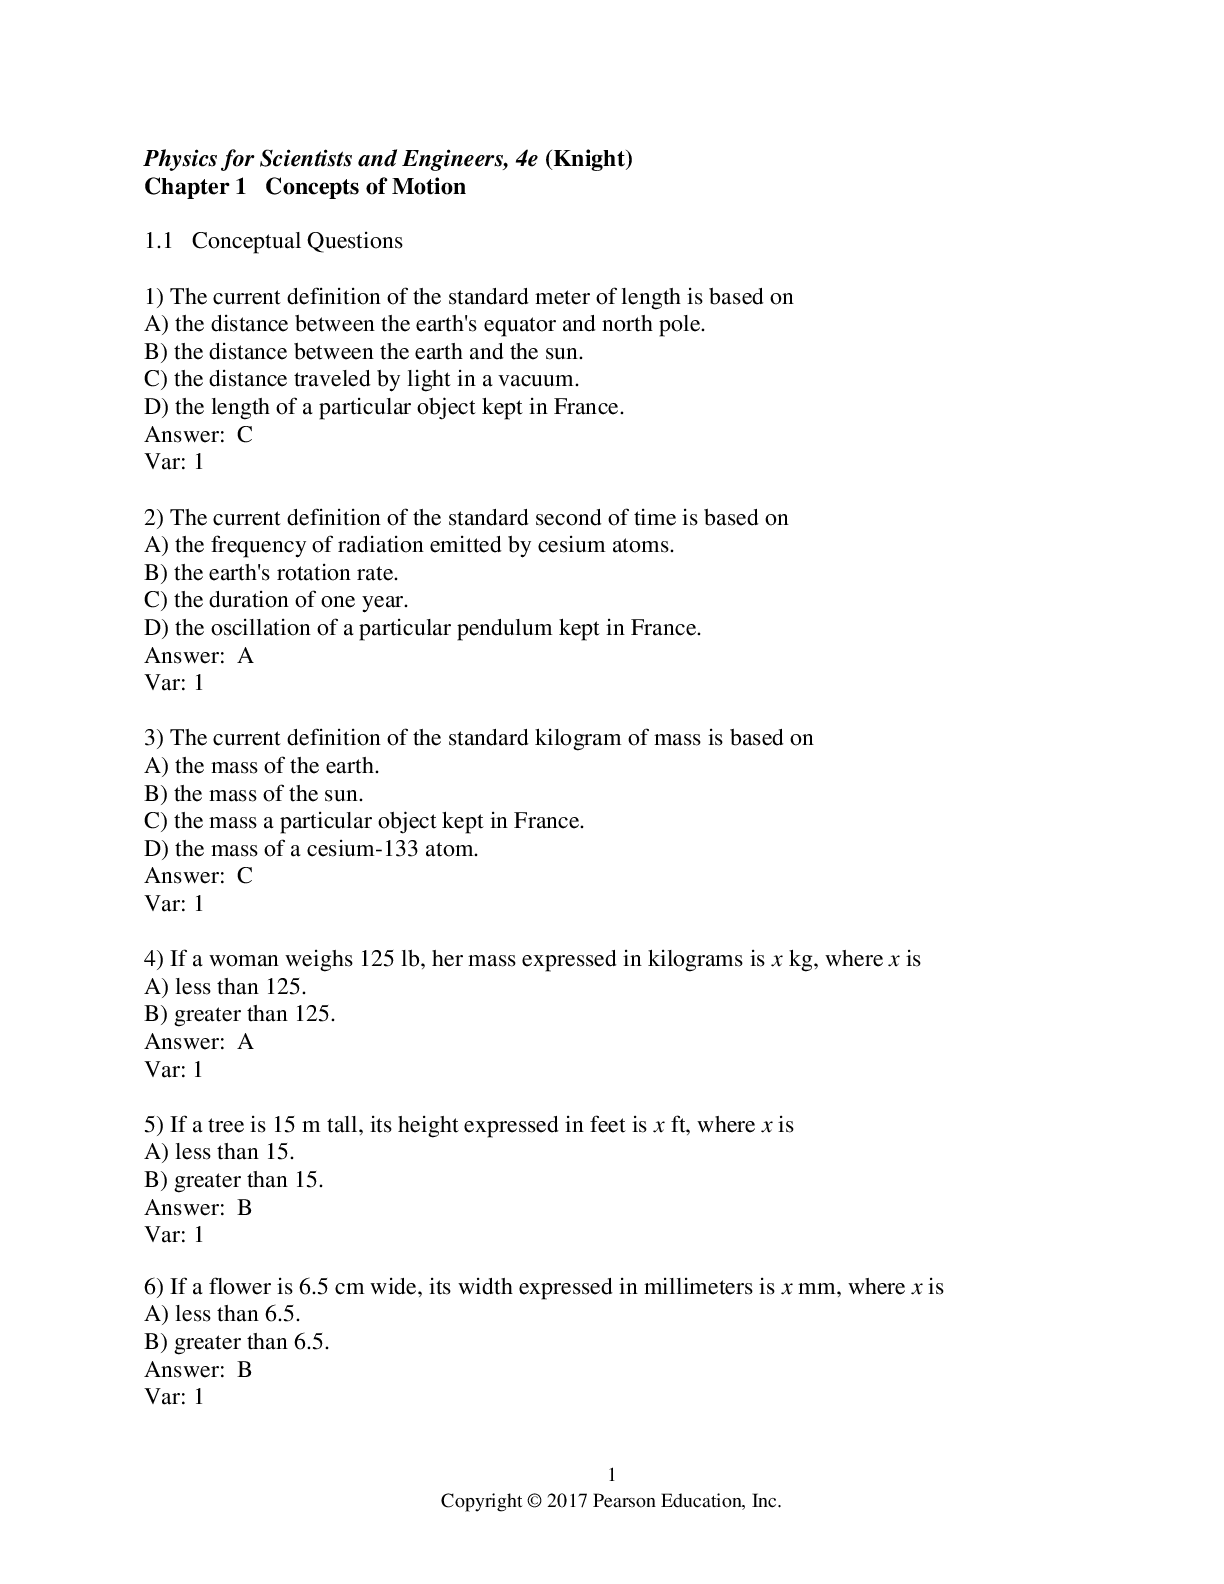
Data & Analysis
The mass of glider was found to be .381 kg. My partner and I estimated the amplitude to be .5m
and the period to be 2.5 seconds from looking at the position vs time graph in the Capstone
window. We estimated the amplitude by looking at the height of the first peak. For the period we
found how much time there was between one peak and the next and took this to be the estimated
period
[Show More]
.png)

.png)
.png)
.png)

.png)
.png)


.png)


.png)
.png)


.png)


.png)

.png)
