Business > QUESTIONS & ANSWERS > Chapter 23—Bivariate Statistical Analysis: Measures of Association. All Answers (All)
Chapter 23—Bivariate Statistical Analysis: Measures of Association. All Answers
Document Content and Description Below
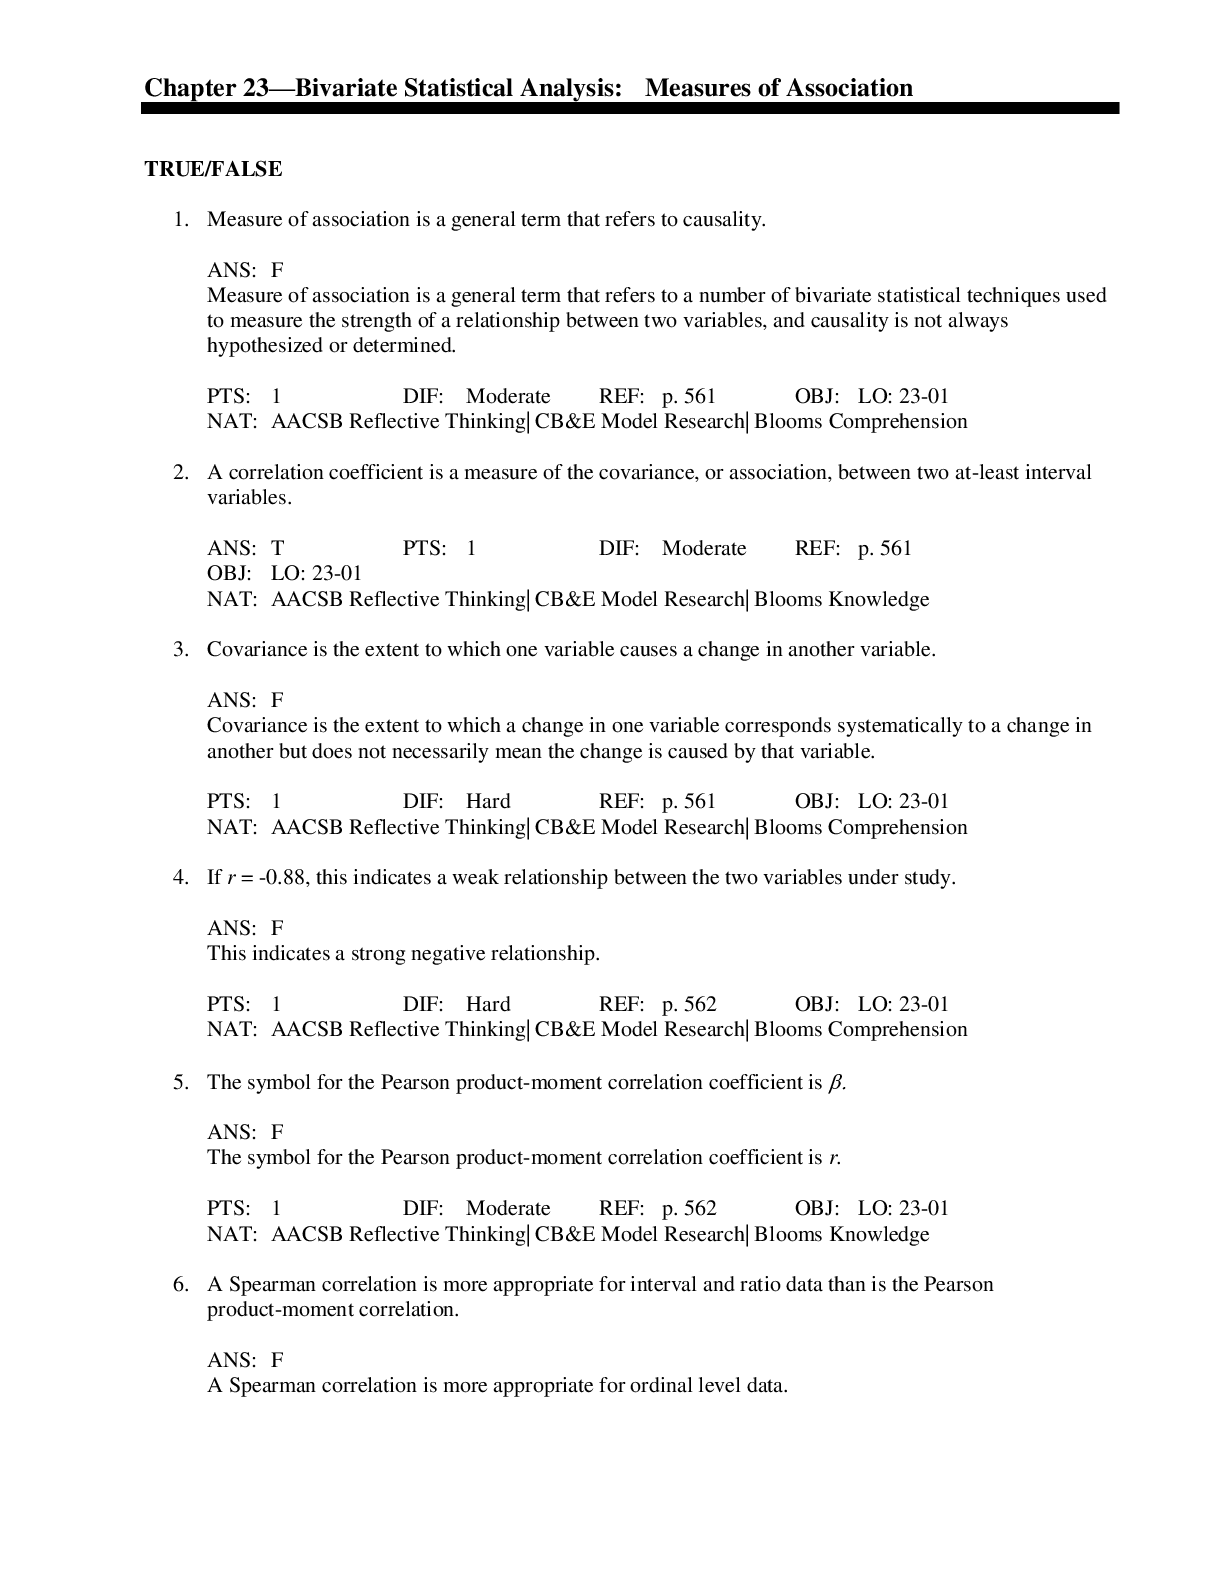
TRUE/FALSE 1. Measure of association is a general term that refers to causality. : F Measure of association is a general term that refers to a number of bivariate statistical techniques used t... o measure the strength of a relationship between two variables, and causality is not always hypothesized or determined. PTS: 1 DIF: Moderate REF: p. 561 OBJ: LO: 23-01 NAT: AACSB Reflective Thinking| CB&E Model Research| Blooms Comprehension 2. A correlation coefficient is a measure of the covariance, or association, between two at-least interval variables. : T PTS: 1 DIF: Moderate REF: p. 561 OBJ: LO: 23-01 NAT: AACSB Reflective Thinking| CB&E Model Research| Blooms Knowledge 3. Covariance is the extent to which one variable causes a change in another variable. : F Covariance is the extent to which a change in one variable corresponds systematically to a change in another but does not necessarily mean the change is caused by that variable. PTS: 1 DIF: Hard REF: p. 561 OBJ: LO: 23-01 NAT: AACSB Reflective Thinking| CB&E Model Research| Blooms Comprehension 4. If r = -0.88, this indicates a weak relationship between the two variables under study. : F This indicates a strong negative relationship. PTS: 1 DIF: Hard REF: p. 562 OBJ: LO: 23-01 NAT: AACSB Reflective Thinking| CB&E Model Research| Blooms Comprehension 5. The symbol for the Pearson product-moment correlation coefficient is : F The symbol for the Pearson product-moment correlation coefficient is r. PTS: 1 DIF: Moderate REF: p. 562 OBJ: LO: 23-01 NAT: AACSB Reflective Thinking| CB&E Model Research| Blooms Knowledge 6. A Spearman correlation is more appropriate for interval and ratio data than is the Pearson product-moment correlation. : F A Spearman correlation is more appropriate for ordinal level data. PTS: 1 DIF: Hard REF: p. 562 OBJ: LO: 23-01 NAT: AACSB Reflective Thinking| CB&E Model Research| Blooms Knowledge 7. The correlation coefficient, r, indicates the magnitude of the linear relationships but not the direction of that relationship. : F A correlation coefficient indicates both the magnitude of the linear relationship and the direction of that relationship. PTS: 1 DIF: Moderate REF: p. 563 OBJ: LO: 23-01 NAT: AACSB Reflective Thinking| CB&E Model Research| Blooms Knowledge 8. The square of the correlation coefficient indicates the part of the total variance of dependent variable that can be accounted for by the independent variable. : T PTS: 1 DIF: Moderate REF: p. 564 OBJ: LO: 23-01 NAT: AACSB Reflective Thinking| CB&E Model Research| Blooms Knowledge 9. A correlation matrix is the standard form for reporting observed correlations between two variables. : T PTS: 1 DIF: Easy REF: p. 565 OBJ: LO: 23-02 NAT: AACSB Reflective Thinking| CB&E Model Research| Blooms Knowledge 10. In a correlation matrix, the main diagonal contains correlations of 1.00 because it represents a variable’s correlation with itself. : T PTS: 1 DIF: Moderate REF: p. 565 OBJ: LO: 23-02 NAT: AACSB Reflective Thinking| CB&E Model Research| Blooms Comprehension 11. The statistical significance of a correlation can be tested using the t-test. : T PTS: 1 DIF: Moderate REF: p. 566 OBJ: LO: 23-02 NAT: AACSB Reflective Thinking| CB&E Model Research| Blooms Knowledge 12. In regression analysis, the equation of a straight line is Y = a + X. : T PTS: 1 DIF: Moderate REF: p. 568 OBJ: LO: 23-03 NAT: AACSB Reflective Thinking| CB&E Model Research| Blooms Knowledge 13. In a regression equation, the slope of the line, , is the change in X that is due to a corresponding change of one unit of Y. : F In a regression equation, the slope of the line, , is the change in Y that is due to a corresponding change of one unit of X. PTS: 1 DIF: Moderate REF: p. 568 OBJ: LO: 23-03 NAT: AACSB Reflective Thinking| CB&E Model Research| Blooms Comprehension 14. In most business research, the estimate of in a regression equation is most important. : T PTS: 1 DIF: Moderate REF: p. 566 OBJ: LO: 23-03 NAT: AACSB Reflective Thinking| CB&E Model Research| Blooms Comprehension 15. In simple regression, standardized parameter estimates reflect the measurement scale range. : F In simple regression, raw parameter estimates reflect the measurement scale range. PTS: 1 DIF: Moderate REF: p. 569 OBJ: LO: 23-03 NAT: AACSB Reflective Thinking| CB&E Model Research| Blooms Comprehension 16. In regression, the standardized Y-intercept term is always 0. : T PTS: 1 DIF: Moderate REF: p. 569 OBJ: LO: 23-03 NAT: AACSB Reflective Thinking| CB&E Model Research| Blooms Knowledge 17. If the purpose of the regression analysis is forecasting, then standardized regression estimates must be used. : F Raw parameter estimates must be used for forecasting. PTS: 1 DIF: Moderate REF: p. 569 OBJ: LO: 23-03 NAT: AACSB Reflective Thinking| CB&E Model Research| Blooms Comprehension 18. One way to determine the relationship between X and Y is to simply visually draw the best-fit straight line through the points in the figure. : T PTS: 1 DIF: Moderate REF: p. 571 OBJ: LO: 23-03 NAT: AACSB Reflective Thinking| CB&E Model Research| Blooms Knowledge 19. The ordinary least-squares method of regression analysis is based on the logic of how much better a regression line can predict values of Y compared to simply using the standard deviation as a prediction. : F The ordinary least-squares method of regression analysis is based on the logic of how much better a regression line can predict values of Y compared to simply using the mean as a prediction. PTS: 1 DIF: Hard REF: p. 571 OBJ: LO: 23-04 NAT: AACSB Reflective Thinking| CB&E Model Research| Blooms Knowledge 20. The least-squares regression line minimizes the sum of the squared deviations of the actual values from the predicted values in the regression line. : T PTS: 1 DIF: Moderate REF: p. 571 OBJ: LO: 23-04 NAT: AACSB Reflective Thinking| CB&E Model Research| Blooms Knowledge 21. The statistical significance of a regression model is determined by a F-test. : T PTS: 1 DIF: Moderate REF: p. 572 OBJ: LO: 23-04 NAT: AACSB Reflective Thinking| CB&E Model Research| Blooms Knowledge 22. The coefficient of determination reflects the proportion of variance that can be explained by the regression line. : T PTS: 1 DIF: Moderate REF: p. 573 OBJ: LO: 23-04 NAT: AACSB Reflective Thinking| CB&E Model Research| Blooms Knowledge 23. A rule of thumb for R2 is that it must be greater than 0.80 for a regression model to be significant. : F Guidelines for R2 values are neither simple nor straightforward. Additionally, R2 does not provide a test of significance, but rather reflects the proportion of variance explained by the regression line. PTS: 1 DIF: Moderate REF: p. 574 OBJ: LO: 23-04 NAT: AACSB Reflective Thinking| CB&E Model Research| Blooms Comprehension 24. The first step in interpreting simple regression output is to interpret the individual parameter coefficient. : F The first step in interpreting simple regression output is to interpret the overall significance of the model. PTS: 1 DIF: Moderate REF: p. 574 OBJ: LO: 23-05 NAT: AACSB Reflective Thinking| CB&E Model Research| Blooms Comprehension 25. If the regression weight is in the hypothesized direction, the hypothesis is supported. : F While it is true that the weight must be in the hypothesized direction, it must also be significant as well. PTS: 1 DIF: Hard REF: p. 577 OBJ: LO: 23-05 NAT: AACSB Reflective Thinking| CB&E Model Research| Blooms Comprehension MULTIPLE CHOICE 1. When the on-time performance of airlines is used to predict the number of customer complaints in a regression equation, on-time performance is the ______ variable and the number of customer complaints is the ______ variable. a. independent; dependent b. dependent; dependent c. dependent; independent d. independent; predictor : A PTS: 1 DIF: Hard REF: p. 561 OBJ: LO: 23-01 NAT: AACSB Reflective Thinking| CB&E Model Research| Blooms Application 2. A bivariate statistical technique that is used to measure the strength of the relationship between two variables is called a _____. a. one-group t-test b. two-group t-test c. measure of association d. correlation matrix : C PTS: 1 DIF: Moderate REF: p. 561 OBJ: LO: 23-01 NAT: AACSB Reflective Thinking| CB&E Model Research| Blooms Knowledge 3. A(n) _____ is a statistical measure of the covariation, or association, between two at-least interval variables. a. alpha coefficient b. beta coefficient c. correlation coefficient d. 2 : C PTS: 1 DIF: Moderate REF: p. 561 OBJ: LO: 23-01 NAT: AACSB Reflective Thinking| CB&E Model Research| Blooms Knowledge 4. The extent to which a change in one variable corresponds systematically to a change in another is called _____. a. spurious association b. significance c. covariance d. standardized coefficient : C PTS: 1 DIF: Moderate REF: p. 561 OBJ: LO: 23-01 NAT: AACSB Reflective Thinking| CB&E Model Research| Blooms Knowledge 5. The Pearson product-moment correlation requires what type of scale for the data? a. nominal b. interval c. ordinal d. all of these choices : B PTS: 1 DIF: Moderate REF: p. 562 OBJ: LO: 23-01 NAT: AACSB Reflective Thinking| CB&E Model Research| Blooms Comprehension 6. The Pearson product-moment correlation coefficient ranges between _____. a. zero and +1.0 b. -1.0 and zero c. -1.0 and +1.0 d. -2.0 and +2.0 : C PTS: 1 DIF: Moderate REF: p. 561 OBJ: LO: 23-01 NAT: AACSB Reflective Thinking| CB&E Model Research| Blooms Knowledge 7. If there is no relationship between two variables, the correlation coefficient between them would be _____. a. +1.0 b. -1.0 c. +0.50 d. 0 : D PTS: 1 DIF: Moderate REF: p. 561 OBJ: LO: 23-01 NAT: AACSB Reflective Thinking| CB&E Model Research| Blooms Comprehension 8. If the correlation between two variables is - 0.85, this me that ____. a. there is a weak positive relationship between the variables b. there is a strong inverse relationship between the variables c. there is a weak negative relationship between the variables d. there is a strong positive relationship between the variables : B PTS: 1 DIF: Moderate REF: p. 563 OBJ: LO: 23-01 NAT: AACSB Reflective Thinking| CB&E Model Research| Blooms Comprehension 9. When the correlation between two variables is +0.92, this me that as one variable ______ , the other variable ______. a. decreases; increases b. increases; stays the same c. increases; increases d. decreases; stays the same : C PTS: 1 DIF: Moderate REF: p. 563 OBJ: LO: 23-01 NAT: AACSB Reflective Thinking| CB&E Model Research| Blooms Comprehension 10. The _____ is a measure obtained by squaring the correlation coefficient. a. t-statistic b. coefficient of determination (R2) c. F-ratio d. Pearson coefficient : B PTS: 1 DIF: Moderate REF: p. 564 OBJ: LO: 23-01 NAT: AACSB Reflective Thinking| CB&E Model Research| Blooms Knowledge 11. Which of the following represents the proportion of the total variance of a variable accounted for by another value of another variable? a. product-moment correlation b. correlation coefficient c. F-test d. coefficient of determination : D PTS: 1 DIF: Moderate REF: p. 564 OBJ: LO: 23-01 NAT: AACSB Reflective Thinking| CB&E Model Research| Blooms Knowledge 12. If the correlation coefficient is - 0.62, the coefficient of determination is approximately: a. + 0.38 b. + 0.62 c. - 0.38 d. - 0.23 : A PTS: 1 DIF: Hard REF: p. 564 OBJ: LO: 23-01 NAT: AACSB Analytic| CB&E Model Research| Blooms Application 13. If the correlation between X and Y is -0.72, approximately what percentage of the variance in Y can be explained by X? a. 52 percent b. 72 percent c. 85 percent d. 28 percent : A PTS: 1 DIF: Hard REF: p. 564 OBJ: LO: 23-01 NAT: AACSB Analytic| CB&E Model Research| Blooms Application 14. Which of the following is the standard form for reporting observed correlations among multiple variables? a. correlation matrix b. contingency table c. Pearson grid d. inverse table : A PTS: 1 DIF: Moderate REF: p. 565 OBJ: LO: 23-02 NAT: AACSB Reflective Thinking| CB&E Model Research| Blooms Knowledge 15. In a correlation matrix, the correlations in the main diagonal are all equal to _____. a. -1.00 b. 0 c. +0.50 d. +1.00 : D PTS: 1 DIF: Moderate REF: p. 565 OBJ: LO: 23-02 NAT: AACSB Reflective Thinking| CB&E Model Research| Blooms Comprehension 16. If the t-test is used to test the significance of a correlation coefficient, it is hypothesized that _____. a. r = +1.00 b. r = 0 c. r = -1.00 d. r = 100 : B PTS: 1 DIF: Hard REF: p. 566 OBJ: LO: 23-02 NAT: AACSB Reflective Thinking| CB&E Model Research| Blooms Comprehension 17. Regression is a(n) _____ technique whereas correlation is a(n) _____ technique. a. dependence; interdependence b. interdependence; dependence c. primary; secondary d. univariate; bivariate : A PTS: 1 DIF: Hard REF: p. 566 OBJ: LO: 23-03 NAT: AACSB Reflective Thinking| CB&E Model Research| Blooms Comprehension 18. In regression analysis, the symbol X is commonly used for the ______ variable, and the symbol Y is commonly used for the ______ variable. a. dependent; moderating b. independent; dependent c. dependent; independent d. independent; moderating : B PTS: 1 DIF: Moderate REF: p. 566 OBJ: LO: 23-03 NAT: AACSB Reflective Thinking| CB&E Model Research| Blooms Knowledge 19. In regression analysis, the dependent variable is also called the _____ variable. a. predictor b. exogenous c. criterion d. internal : C PTS: 1 DIF: Moderate REF: p. 566 OBJ: LO: 23-03 NAT: AACSB Reflective Thinking| CB&E Model Research| Blooms Knowledge 20. In the regression equation, Y = a + X, Y is the _____. a. dependent variable b. slope c. independent variable d. Y-intercept : A PTS: 1 DIF: Moderate REF: p. 56 OBJ: LO: 23-03 NAT: AACSB Reflective Thinking| CB&E Model Research| Blooms Comprehension 21. In the regression equation, Y = a + X , is the _____. a. y-intercept b. independent variable c. slope of the regression line d. dependent variable : C PTS: 1 DIF: Moderate REF: p. 568 OBJ: LO: 23-03 NAT: AACSB Reflective Thinking| CB&E Model Research| Blooms Comprehension 22. In the regression equation, Y = a + X, a is the symbol for the _____. a. slope of the regression line b. Y-intercept of the regression line c. dependent variable d. independent variable : B PTS: 1 DIF: Moderate REF: p. 568 OBJ: LO: 23-03 NAT: AACSB Reflective Thinking| CB&E Model Research| Blooms Comprehension 23. If the regression equation is: Y = 24.35 - 14.2 X , then 24.35 is the ______ , while -14.2 is the ______. a. slope; y-intercept b. independent variable; slope c. dependent variable; y-intercept d. Y-intercept; slope : D PTS: 1 DIF: Hard REF: p. 568 OBJ: LO: 23-03 NAT: AACSB Reflective Thinking| CB&E Model Research| Blooms Application 24. If the regression equation is: Y = -4.2 + 3.6 X , then the expected score for Y when X is 4 would be _____. a. -18.6 b. 10.2 c. 18.6 d. 4 : B PTS: 1 DIF: Hard REF: p. 568 OBJ: LO: 23-03 NAT: AACSB Analytic| CB&E Model Research| Blooms Application 25. Which of the following provides a common metric allowing regression results to be compared to one another no matter what the original scale range may have been? a. standardized regression coefficient () b. 2 c. coefficient of determination (R2) d. raw parameter estimates : A PTS: 1 DIF: Moderate REF: p. 569 OBJ: LO: 23-03 NAT: AACSB Reflective Thinking| CB&E Model Research| Blooms Knowledge 26. Which of the following is most appropriate if the purpose of the regression analysis is forecasting? a. standardized regression coefficient () b. Y-intercept c. coefficient of determination (R2) d. raw parameter estimates : D PTS: 1 DIF: Moderate REF: p. 569 OBJ: LO: 23-03 NAT: AACSB Reflective Thinking| CB&E Model Research| Blooms Knowledge 27. Lance is studying the relationship between sales training of the sales force and customer satisfaction and loyalty. When researchers like Lance are focused on explanation rather than prediction, then which of the following is most appropriate when using simple regression? a. standardized regression coefficient () b. Y-intercept c. 2 d. raw parameter estimates : A PTS: 1 DIF: Hard REF: p. 569 OBJ: LO: 23-03 NAT: AACSB Reflective Thinking| CB&E Model Research| Blooms Application 28. All of the following are simple regression estimation techniques EXCEPT _____. a. chi-square estimation b. maximum likelihood c. visual estimation d. ordinary least squares (OLS) : A PTS: 1 DIF: Hard REF: p. 569 OBJ: LO: 23-03 NAT: AACSB Reflective Thinking| CB&E Model Research| Blooms Knowledge 29. Which regression estimation technique is based on the logic of how much better a regression line can predict values of Y compared to simply using the mean as a prediction for all observations no matter what the value of X may be? a. visual estimation b. maximum likelihood c. coefficient of determination d. ordinary least squares (OLS) : D PTS: 1 DIF: Moderate REF: p. 571 OBJ: LO: 23-04 NAT: AACSB Reflective Thinking| CB&E Model Research| Blooms Knowledge 30. The statistical significance of a regression model is determined using which test? a. t-test b. 2 c. F-test d. Z-test : C PTS: 1 DIF: Moderate REF: p. 573 OBJ: LO: 23-04 NAT: AACSB Reflective Thinking| CB&E Model Research| Blooms Knowledge 31. What is the first step in interpreting a simple regression output? a. interpret the individual parameter estimates b. determine the degrees of freedom c. look at the 2 to see if it is significant d. interpret the overall significance of the model : D PTS: 1 DIF: Moderate REF: p. 574 OBJ: LO: 23-05 NAT: AACSB Reflective Thinking| CB&E Model Research| Blooms Comprehension COMPLETION 1. If the number of coupons given out at shopping malls is used to predict the number of tickets that will be sold to a country and western band's performance at a local club, the number of coupons is the ______ variable. 2. The statistical measure of the association between two variables is known as the ______ coefficient. 3. The extent to which a change in one variable corresponds systematically to a change in another is referred to as _____. 4. The Pearson product-moment correlation requires at least ______ data. 5. The Pearson product-moment correlation coefficient ranges between ______ and ______. 6. A correlation coefficient indicates both the ______ of the relationship between two variables and the ______ of this relationship. 7. Covariation in which the association between variables is in the opposite direction indicates a(n) _____ relationship. 8. The square of the correlation coefficient is called the _____. 9. The symbol for the coefficient of determination is _____. 10. If the correlation between two variables is -.55, the coefficient of determination is approximately ______. 11. The standard format for reporting the correlations between several variables is called the ______. 12. In a correlation matrix, the values in the main diagonal equal ______. 13. In testing for the significance of a correlation, it is hypothesized that the correlation is equal to ______. 14. The regression parameter that represents the height of the regression line relative to horizontal is _____. 15. In a regression equation, the slope of the regression line is denoted by the symbol ______. 16. If the purpose of the regression analysis is forecasting, then _____ parameter estimates must be used. 17. _____ regression estimates should be used when the researcher is testing explanatory hypotheses. 18. The technique use in regression analysis that guarantees that the resulting straight line will produce the least possible total error in using X to predict Y is called the _____ method. 19. The test for the statistical significance of the regression model is the ____ test. 20. The first step in interpreting a simple regression output is to interpret the significance of the _____. ESSAY 1. Discuss the common procedures for testing association for data that are nominal, ordinal, and interval/ratio. : For nominal data, the statistical choice is cross-tabulation with 2 test. For ordinal data, the statistical 2. Compare and contrast correlation, covariance, and causation. : Concomitant variation is one condition needed to establish a causal relationship between two variables. When two variables covary, they display concomitant variation. This systematic 3. Explain how regression differs from correlation. : Regression analysis is a technique for measuring the linear association between a dependent and an independent variable. Although simple regression and correlation are mathematically equivalent in 4. Discuss the pros and cons of raw regression estimates and standardized regression estimates and discuss when each is appropriate. : Regression parameter estimates can be presented in either raw or standardized form. One potential 5. Explain the ordinary least-squares (OLS) method of regression analysis and the logic behind it. : 6. Discuss the steps in interpreting a simple regression output. : Interpreting simple regression output is a simple two-step process: (1) Interpret the overall significance of the model. The output will include the “model F” and a [Show More]
Last updated: 2 years ago
Preview 1 out of 15 pages
Buy this document to get the full access instantly
Instant Download Access after purchase
Buy NowInstant download
We Accept:

Reviews( 0 )
$9.00
Can't find what you want? Try our AI powered Search
Document information
Connected school, study & course
About the document
Uploaded On
Jan 06, 2020
Number of pages
15
Written in

Additional information
This document has been written for:
Uploaded
Jan 06, 2020
Downloads
0
Views
48
.png)
.png)
.png)
.png)
.png)
.png)
.png)