Business > CASE STUDY > Task 2 part D .docx C216 C216 MBA Capstone Task 2: Andrews Performance Evaluation D. 1 (All)
Task 2 part D .docx C216 C216 MBA Capstone Task 2: Andrews Performance Evaluation D. 1
Document Content and Description Below
Last updated: 3 years ago
Preview 1 out of 16 pages
Instant download
Buy this Document to get the Full Access Instantly
Provided by Students Who Aced it
We Verify Document Content to Gurantee Accuracy
Reviews( 0 )
Document information
Connected school, study & course
About the document
Uploaded On
Jun 12, 2022
Number of pages
16
Written in
All

Additional information
This document has been written for:
Uploaded
Jun 12, 2022
Downloads
0
Views
104
Document Keyword Tags
Recommended For You
Get more on CASE STUDY »Task 2 part D .docx C216 C216 MBA Capstone Task 2: Andrews...
Task 2 part D .docx C216 C216 MBA Capstone Task 2: Andrew s...
C216 MBA Capstone Task 3 – Passed 2025 Western Governors Unive...
![Preview of C216 MBA Capstone Task 2 - Stockholder Report 2025 [PASSED] western Governors University](https://browseimages.nyc3.digitaloceanspaces.com/paper-images/2025/Aug/13/aqCPUugH2025-08-13-12-31689bb2b9e10ca.png)
C216 MBA Capstone Task 2 - Stockholder Report 2025 [PASSED] we...

C216 MBA Capstone Task 1 PPT Presentation 2025-2026 Western Go...


Solution Manual for Canadian Income Taxation 20232024 26th Edi...
Solution Manual for Canadian Income Taxation (2022-2023) 25th...
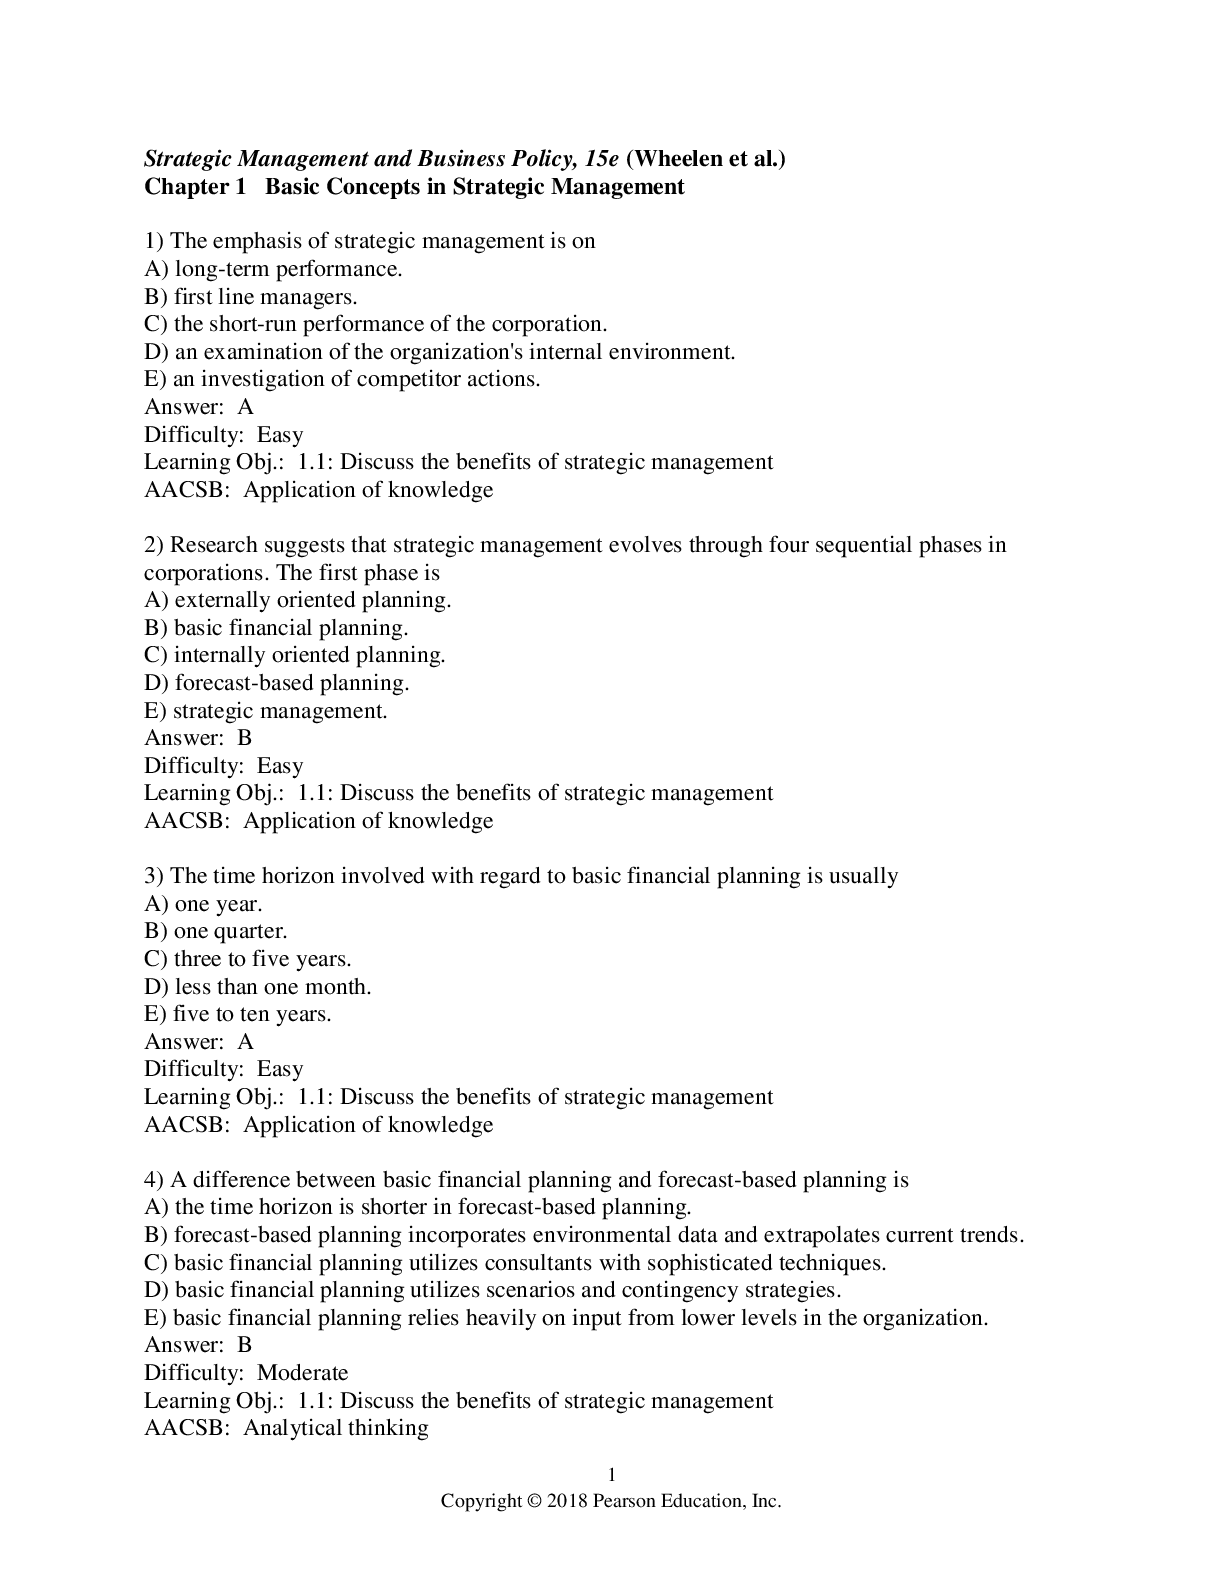
Concepts in Strategic Management and Business Policy Globaliza...