Food and Nutrition > PROJECT FINAL > Food Environments and Obesity: Household Diet Expenditure versus Food Deserts (All)
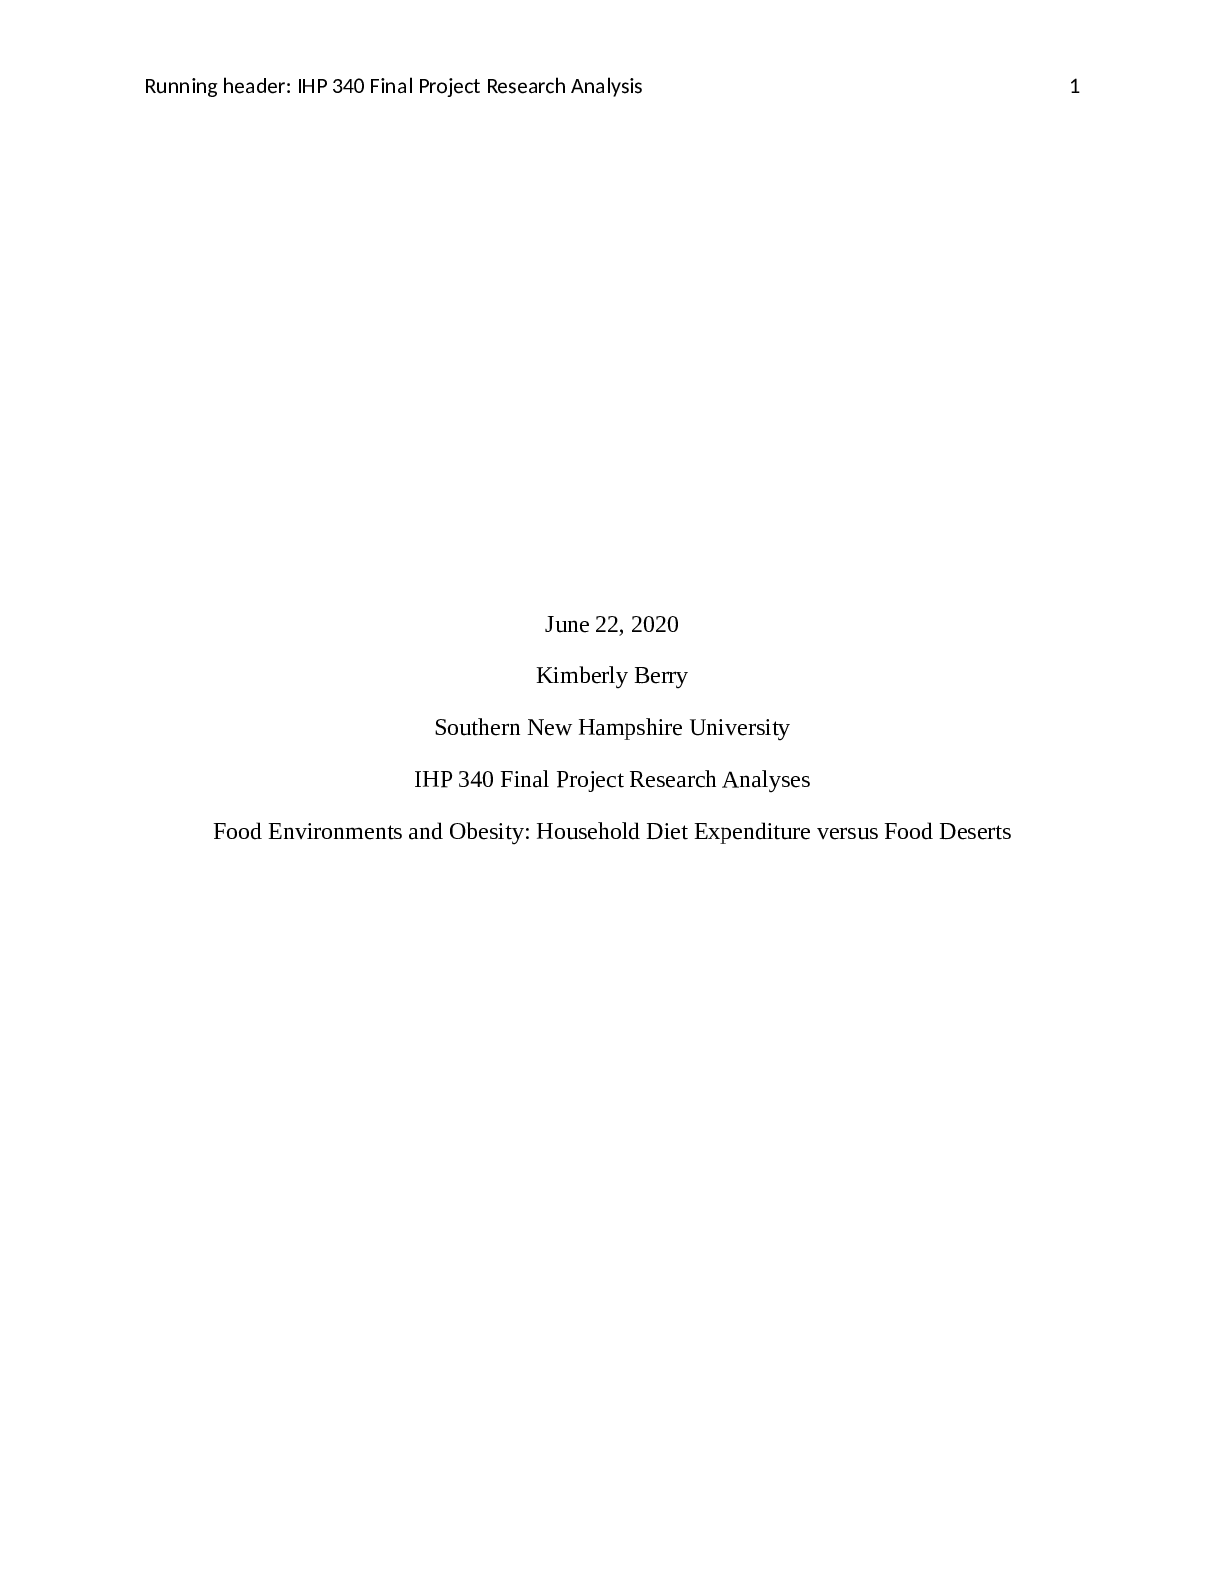
Food Environments and Obesity: Household Diet Expenditure versus Food Deserts
Document Content and Description Below
The study was conducted to determine the association and relation between food environments and obesity. The research question was to identify how various aspects of food environment that is at home... and in the neighborhood, could relate to obesity and whether they contributed to the incidences of obesity. The hypothesis of the study was to find out the impact of food behavior methods on the increasing obesity rates in the United States population. This was to determine whether it was a positive effect or negative consequences. The research is more of an observable study than experimental because, even though the researchers may be manipulating a variable, they have been observing the ongoing behavior of consumers. The intruded the environment and controlled environment. For example, following the household diet practices versus the food deserts which would probably contribute to increase in obesity. This included 40,000 individuals who were involved in the research experiment and the sample population. Data collection methods used was a digital way of collecting data using a home scanning device/ for example, according to the researcher a compiled data set from several sources. The data came from consumer panel data and med profiler data which reflected all food purchases from the year 2008-2012. Also, various questionnaires were administered by the individuals and household level. The method provided a cheap, efficient, and quicker ways of getting substantial amounts of data from a large target sample of the population. An example, according to Jaenicke et al. (2016) most individuals in the adult sample population had an average total of 28.50 BMI which was consistent with calculated results by Flegal et al. with US adults averaging 28.70. The research was a quantitative study which is characterized by the inclusion of a statistical, mathematical or numerical analysis of the collected data either via surveys, questionnaires, polls or manipulating pre-existing statistical information using This study source was downloaded by 100000796615030 from CourseHero.com on 07-18-2021 08:06:53 GMT -05:00 https://www.coursehero.com/file/26899303/article-analysisdoc/ This study resource was shared via CourseHero.com ARTICLE ANALYSIS 2 computational techniques. In this study, the data obtained was numerical through counts and measurement integers which included the total number of obese individuals per household. For example, an approximate of 39,000 persons in US countries. One of the potential weakness of using questionnaires for data collection is that there is a possibility for low response rate. This is disadvantaging when it comes to statistical analysis thus lowering confidences in the results of the study. Another weakness is that they are little flexible for the respondents in respect to response format. Lack of personal contact with the users could significantly affect the response expected; participants are likely to give false information due to social desirability. For example, sequentially, a considerable number of households located in the metro showed a low probability of individuals being obese and results were substantial with data from 2005 to 2008 NHANES (Chen et al., 2016). In this instance, the returned questionnaires could be assumed to have been filled by the same person issued to. But this is not the case most of the times because the employee may fill them for the business, house wives for their husbands or kids respond as a prank; thus collecting erroneous data. The descriptive statistics for each level were calculated. The researchers based their major analyses on random-intercept logistics models with random components at household, individual and neighborhood level. The statistical analysis was done by using an analytics software stats version 13 (StataCorp LP, College Station, TX). Hypothesis testing was also used to test whether the statements which were true remained to be true or false. For example, the data analysis methods are significant as it enables the testing of two states. It made it possible to determine that indeed food behavior had a profound impact on the rising increase of obesity cases. For the hypothesis method of analysis, lacks appropriateness of data where the data collected can be for past years and studies. For instance, from the study, the full data set contained about 38 This study source was downloaded by 100000796615030 from CourseHero.com on 07-18-2021 08:06:53 GMT -05:00 https://www.coursehero.com/file/26899303/article-analysisdoc/ This study resource was shared via CourseHero.com ARTICLE ANALYSIS 3 650 individuals in the US during the 2014 study. For the stats software, it is an expensive method for analyzing data, and it uses algorithms which are not open to the public. The critical demography applied in the testing of the sample mean included key demographics mainly consisting of adults who took part in answering the questionnaires to determine the relationship of food to overweight cases (individuals, households and neighborhood) e.g The study revealed that neighborhood environmental factors including food behaviors and dessert are highly associated with obesity status even after controlling for environmental food factors (AMJ Public Health). According to the study, a third of the total sample was found to be overweight; one-third was obese which was consistent with statistics basing on other nationally representative surveys like a survey contacted by National Health and Nutrition Examination Survey (NHANES). The average BMI of the adult sample was 28.50, and this was compared to a calculation carried out by Flegal (2009); which was 28.7 based on height and weights measured. The results were based on control groups such as age, race, and education level and lifestyle choices like doing exercises. Therefore, all lifestyle choice and demographics were associated with obesity or overweight significantly. Age and obesity or overweight status had a positive relationship, and the female was found to have a negative association with the obesity and overweight status. Those who relied on the high diet had a probability of being obese or overweight. Also, consumption of fast foods regularly showed a positive association. For the exercise, a negative relationship was studied. Whites and Non-Hispanic Blacks were found more likely to be overweight and obese than Asians. Those who lived in families with college and post college household heads were less liable to become obese or overweight, unlike the ones whose heads had a high school education and below. This study source was downloaded by 100000796615030 from CourseHero.com on 07-18-2021 08:06:53 GMT -05:00 https://www.coursehero.com/file/26899303/article-analysisdoc/ This study resource was shared via CourseHero.com ARTICLE ANALYSIS 4 One limitation presented by the survey population and sample size used was that the models used for estimation did show different statistics for metro subsample differing from those of nonmetro subsamples. For example, mixed results were found for the relationship between neighborhood food environment variables and obesity or overweight status. However, the results of subsamples were consistent all through and like those from the full sample. Descriptive analysis of statistical data is a simple method which is used to reflect the values of all data in the final calculation. It is not difficult to calculate, and it is accurate. However, it cannot be used with nominal data, and it does not describe data well when several modes are involved. The study design used was experimental. The restriction of the model is that it did not clarify why the outcomes occurred. This is because, when an experimental study is carried out in a natural environment, like community, the experimenters cannot control the variables. It is a tool powerful for determining and confirming causation. The mixed result of metro subsample showed that food desert indicator was positively related to obesity or overweight yet, on the other hand, the density relations of store types differed (Courtemanche, 2011). Nonetheless, according to the study, these mixed results were like those of other research. For example, with the findings of Courtemanche and Carden. This study has contributed significantly to scientific literature in that, getting to find the relationship between obesity or overweight status with food environment is provided knowledge that can be relied on by other researchers and possibly opening a platform for further research. Also, it has combined several areas of they where most studies investigate a single space. For example, combining households, individuals, and neighborhood food environments. [Show More]
Last updated: 2 years ago
Preview 1 out of 6 pages

Buy this document to get the full access instantly
Instant Download Access after purchase
Buy NowInstant download
We Accept:

Reviews( 0 )
$7.00
Can't find what you want? Try our AI powered Search
Document information
Connected school, study & course
About the document
Uploaded On
Jul 18, 2021
Number of pages
6
Written in
Additional information
This document has been written for:
Uploaded
Jul 18, 2021
Downloads
0
Views
110


