Statistics > QUESTIONS & ANSWERS > IF1202 Exam Paper 1415 - Solutions Final and Correct Version. (All)
IF1202 Exam Paper 1415 - Solutions Final and Correct Version.
Document Content and Description Below
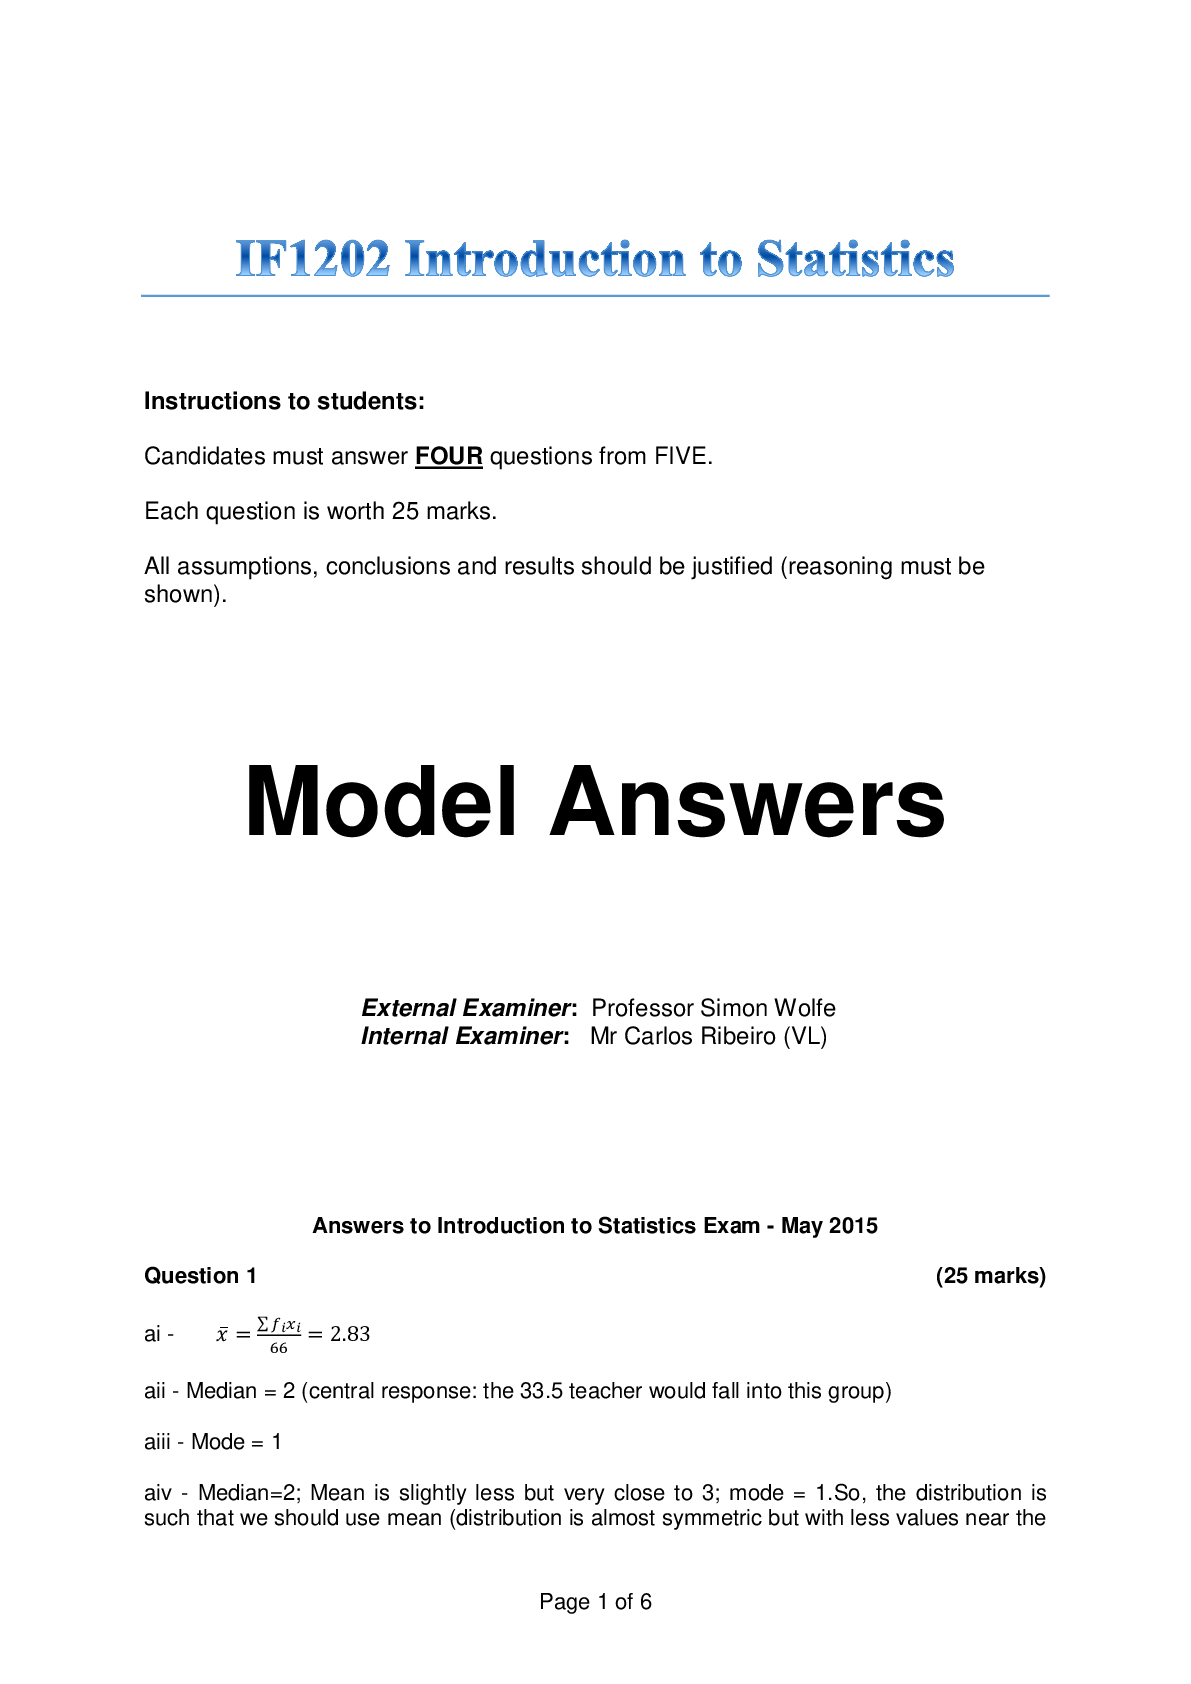
IF1202 Introduction to Statistics Instructions to students: Candidates must answer FOUR questions from FIVE. Each question is worth 25 marks. All assumptions, conclusions and results sh... ould be justified (reasoning must be shown). Model Answers External Examiner: Professor Simon Wolfe Internal Examiner: Mr Carlos Ribeiro (VL) Answers to Introduction to Statistics Exam - May 2015 Question 1 (25 marks) ai - x ̅=(∑▒〖f_i x_i 〗)/66=2.83 aii - Median = 2 (central response: the 33.5 teacher would fall into this group) aiii - Mode = 1 aiv - Median=2; Mean is slightly less but very close to 3; mode = 1.So, the distribution is such that we should use mean (distribution is almost symmetric but with less values near the mean, range of values is small); should conclude that most teachers considers that teaching as become less rewarding followed by those who consider it has become more rewarding (Note: concern about the shape of the distribution and interpretation needs to be shown for full marks) (10 marks) biv - Independent means the outcome of one event does not affect probability of the other, which in this case means for instance, P(LW)=P(LW|B). Since P(LW)=157/500=31.4%, which is clearly different from P(LW│B)=55/136=40.44%, we can conclude the events “Likely to by” and colour of the pack are not independent. (15 marks) Question 2 (25 marks) ai – X ~N(4.1,〖1.3〗^2) X ̅~N(4.1,〖1.3〗^2/10) P(4.0<X ̅<4.2)=P((4.0-4.1)/(1.3/√10)<Z<(4.2-4.1)/(1.3/√10))=P(-.24<Z<.24)=1-2×P(Z>.24)=1-2×.4052=.1896 or 18.96% (9 marks) bi – P(blue ball)=5/14=35.71% bii – P(three heads)=(1/2)^3=1/8=12.5 (5 marks) ci – Both variables follow a poisson distribution represented by: where µ = mean or 8 (landings) and 10 (take-offs) movements per 15 minutes and x will vary according to the probability being calculated. cii – 30 minutes => Poisson (20) P(T=25)=e^(-20) 〖20〗^25/25!=.0446 or 4.46% ciii – 6 minutes => Poisson (8/15×6) Poisson (3.2) P(L=6)=e^(-3.2) 〖3.2〗^6/6!=.0608 or 6.08% (6 marks) 4 – H0: μR – μO = 0 H1: μR – μO > 0 No reason for not doing a 95% test, so z-critical = 1.645 , which is in the rejection area, and therefore we reject H0 and accept that, based on the data collected, regular attendance to the library improves your knowledge of words. (5 marks) Question 3 (25 marks) ai – (x_B ) ̅=6.875 (x_A ) ̅=4.375 small sample σ_B=2.71 σ_A=1.41 s^2=(7×〖2.71〗^2+7×〖1.41〗^2)/(8+8-2)=4.6661 n_B=8 n_A=8 H_0: μ_B-μ_A=0 vs H_1: μ_B-μ_A>0 t=(6.875-4.375)/√(4.67/8+4.67/8)=2.31>1.761=t_(14,.05) degrees of freedom =8+8-2=14 Null hypothesis can be rejected, the change was effective aii – Worker 1 2 3 4 5 6 7 8 Improvement 1 7 3 4 -2 1 2 4 x ̅=2.5 σ=2.5 n=8 H_0: μ_I=0 vs H_1:μ_I>0 t=2.5/√(〖2.5〗^2/8)=2.83 < t_7,0.05=1.895 Null hypothesis rejected which means there has been improvement aiii – other office x ̅=6.5 σ=2.55 n=8 H_0: μ_o-μ_I=0 vs H_1: μ_O-μ_I>0 s^2=(7×〖1.41〗^2+7×〖2.55〗^2)/14=4.245 t=(6.5-4.375)/√(4.245/8+4.245/8)=2.063> t_14,0.05=1.761 Null hypothesis rejected, change was effective 1iv – In this case, the comment is that all analysis arrive that the same conclusion, but that that is not necessarily the case in all situations and that the analysis in b is probably more appropriate than the analysis in a, as this one does not eliminate the possible effect of other factors. (18 marks) 2a – H_0:μ_c-μ_m=550 vs H_1:μ_c-μ_m≠550 Z = [(3,800 – 3,550) – 550] / √(5122 / 30 + 4732 / 30) = -2.3573 Z critical for a one-tail test is 1.645, so this is in the rejection area, and we should reject the claim. Bonus for discussion on how close this decision is and if we were to consider the sample small, the answer would be different. Calculation can also be done by building confidence interval for the difference between two means, and test whether zero is included or two confidence intervals for each of the manufacturers and check whether they overlap, as long as the outcome is the same. (7 marks) Question 4 (25 marks) ai - Answer should indicate that: price index uses quantities as weights quantity index uses prices as weights Any example that illustrates the way these indices are calculated is acceptable. aii and aiii - Paasche PnQn 32740 31116 47976 PoQn 32740 28688 40512 Index 100 108.4635 118.4242 Laspeyres PnQo 32740 35588 38812 PoQo 32740 32740 32740 Index 100 108.6988 118.5461 aiv - Not unexpectedly, the values of the indices are similar as relative prices did not change much during the period. (13 marks) bi - Seasonality refers to changes within a year, normally on a quarterly basis, but it can also have different patterns such as for example peaks at Christmas and Easter for sales. Cyclicality refers to changes within a number of years, normally related to economic cycles. bii - As it is an even number, averages need to be taken and then centred, so for example average of first four = (282+279+285+288)/4 = 283.5 and for second to fifth observation = (279+285+288+285)/4 = 284.25, so first average (for period three) will be (283.5+284.25)/2 = 283.875 The averages are: 283.875; 284.75; 285.75; 287.25; 288.875; 2589.75; 290.375; 290.875; 291.5; 292.625; 294.25; 295.875; 297.5; 299.125; 300.375 and 301.875 and respectively biii - Answer should be done by having a line chart with the two sets of data. The average will start one period later and finish one period earlier and it will vary less than the raw data. biv - Answer should identify that moving averages are used to smooth out the irregular element of a time series, as can be seen from the smoother line of the moving averages. There is still some variability as can be seen from the lowest to highest moving average difference of 18 (301.875 - 283.875), but this is much lower than the different between the highest and lowest observation in the raw data of 30 (309 - 279) (12 marks) Question 5 (25 marks) ai – Comment should include: Mean which is 32.9 journeys per month; With a standard deviation of 14.31 journeys per month; The skewness is negative, which means there is a tail to the left of the distribution, as confirmed by the median, which is closer to the maximum value than to the minimum values, and by the fact that Mean < Median < Mode; The sample is small only 20, which may distort the outcome. Confidence interval: 32.9±t_19,0.05 √(204.7263/20)(3.199) t_19,0.05=1.729 [26.204,39.696] (8 marks) bi – Both the correlation table and the regression outputs indicate clearly that overtime hours is the variable with the highest correlation with production level. (3 marks) bii – Discussion should include: Correlation of 0.88 and coefficient of determination of 77%, which is quite high; But there is no certainty of causation, as other variables can impact both the analysed variables; Both coefficients significantly different from zero, as can be seen from t-stat, p-value and/or confidence interval; the regression is also significant, as seen when comparing F-value with Significant F; The value of production without overtime is 1,493 and it will increase by 92.29 units with each additional overtime hour worked; There is no indication of range of significance of the analysis, but it is likely that it will only apply in a certain range. (9 marks) biii – Production = 1,493.44 + 18 * 92.29 = 3,154.66 (2 marks) biv – Additional analysis should look at: Residuals and their patterns; Whether any transformation (1/attendance, log of attendance, etc) would lead to a higher correlation. (3 marks) [Show More]
Last updated: 2 years ago
Preview 1 out of 6 pages

Buy this document to get the full access instantly
Instant Download Access after purchase
Buy NowInstant download
We Accept:

Reviews( 0 )
$10.00
Can't find what you want? Try our AI powered Search
Document information
Connected school, study & course
About the document
Uploaded On
Mar 09, 2020
Number of pages
6
Written in
Additional information
This document has been written for:
Uploaded
Mar 09, 2020
Downloads
0
Views
78


.png)
.png)
.png)
.png)
.png)
.png)
.png)

