Statistics > QUESTIONS & ANSWERS > Nova Southeastern University - QNTP 5000. Questions and Answers (All)
Nova Southeastern University - QNTP 5000. Questions and Answers
Document Content and Description Below
Nova Southeastern University - QNTP 5000Q Chapter 2 Notes Suppose a frequency distribution has the following consecutive classes: Place the following in order when constructing a frequency dist... ribution into correct order Which of the following are characteristics of frequency tables? Which two of the following practices is commonly used in setting class limits for a frequency distribution? Which of the following is true regarding raw data? Which of the following can be observed from a histogram? Match the term with the definition The number of observations in each class is called the class _______. Which of the following is not a characteristic of a frequency distribution? Which of the following are characteristics of bar charts? Which of the following should be a use of a frequency table? The value shown on the vertical axis of a cumulative frequency polygon for a particular class is found by: Which of the following is NOT a characteristic of a frequency distribution? Which one of the following is true regarding raw data? Regarding frequency tables and frequency distributions, which one of the following is true? Which of the following is a feature of a relative frequency distribution? Which two of the following practices is commonly used in setting class limits for a frequency distribution? Place the following steps used in constructing a frequency distribution into correct order: In a frequency polygon the points are plotted at the intersection of the class frequencies and the: Which of the following features is an advantage that the frequency polygon has over the histogram? The value shown on the vertical axis of a cumulative frequency polygon for a particular class is found by: Which of the following can be observed from a histogram? Which of the following is an advantage of a cumulative frequency polygon over a histogram or frequency polygon? Which of the following are characteristics of bar charts? Which of the following is the best definition of “class midpoint”? Which one of the following is true about pie charts? The number of observations in each class is called the class In using the “2 to the k rule” to determine the number of classes for a frequency distribution, what is the meaning of the variable k? To divide data with a high value of H and a low value of L into k classes, the class interval must be: Which of the following operations is true regarding relative frequency distributions? Chapter 3 Practice questions What characteristic of a data set makes the median better measure of the center of the data than the mean? Which of the following kinds of data can be used to find a median value? The Empirical rule states approximately what percentage of observations will be found within some deviation from the mean for a normal distribution. Match the % of observations to the range. Which of the following is the correct formula for the population variance? Which of the following are used to measure dispersion? Check all that apply. Chebyshev’s Theorem states that the proportion of values is at least 1-1/k^2. What is the meaning of k? What is another term for the “average” value of a distribution? Which of the following statements describe weaknesses of the range as a measure of dispersion? Select all that apply. Choose the formula for the Sample Variance In the formula for calculating the mean of grouped data, M stands for: Which of the following is true regarding the application of Chebyshev’s theorem and the Empirical Rule? How do you find the Population Mean for a set of data? A statistic is: Which of the following statements are true of the weighted mean? Select all that apply. Which of the following averages would be calculated using the geometric mean? *Sample standard deviation is: What is the definition of “parameter”? What is the purpose of a measure of location? Which of the following statements represent an ethical approach to the use of statistics? Which of the following are advantages of the variance compared to the range? Given the following population data sets, which has a smaller population variance? What is the variance of the following population data? [2,0,1,9] What is the standard deviation of the following sample data? [2,6,2,0,5] Given the following weights (in ounces) of four apples, 6,8,10 and 7, which of the following is true? Which measure of dispersion results in units that are different from the data? Of the following, which one is an advantage of the standard deviation over the variance? What is the variance of the following sample data? [2,6,2,10] Which statement is true with regards to differences in the formula for the population and samples variances? What is the standard deviation of the following population data? [3,1,2,9,5] What is the standard deviation of the following population data? [3,6,2,9] Which of the following is a statistic? What is the variance of the following population data? What is the variance of the following sample data? [8,6,2,8] Which of the following statements are true of the weighted mean? Which one of the following is an unethical approach to reporting statistics? According to Chebyshev’s theorem, what proportion of observations will lie within 3 standard deviations of the mean for a positively skewed distribution? A stock sold at $32 per share in 2006. By 2016 the price per share was $65. What was the annual rate of increase for the stock? A mutual fund has a rate of return for five years of 10%, 14%,020%,18% and 22%. Calculate the average rate of return (geometric mean). Round to the nearest tenth of a percent. A stock has returns for four years of 5%, 17%, 64% and -35%. Calculate the average annual rate of return (geometric mean). The number of customers using a store’s credit card has grown the last five years at the following rates: 12%, 20%, 31%, -5% and 10%. Calculate the average annual growth rate (geometric mean) Which of the following statements are reasons to study the dispersion of data? According to Chebyshev’s theorem, what proportion of values for a bimodal distribution will be found within two standard deviations of the mean? According to Chebyshev’s theorem, what proportion of observations will lie within 3 standard deviations of the mean for a positively skewed distribution? The average age of undergraduate students at Grand Canyon University is 44. If the standard deviation is 4, what percentage of undergraduate students are between 36 and 52 years old? In 2004 a new car cost $32,000. In 2016 a comparable model costs $54,000. Which of the following will best represent the average annual increase in cost of the car? Which of the following statements is true for a mean or standard deviation calculated for grouped data? Chapter 4 Practice Questions A scatter diagram requires that both of the variables be what kind of data? When you create a dot plot, you do which of these operations? Match the measure of position to the number of parts into which it divides a set of observations. Place these steps in the order in which you would perform them to create a steam and leaf plot. Which one of the following pairs of variables would be best suited for a contingency table? Contingency tables are used for summarizing data of what level? Match the quartiles on the left with their definition on the right Which of the following is not a measure of position in a set of data except? If a set of data exhibits significant positive skewness, then which of the following would be expected of Pearson’s coefficient of skewness? Which of the following statements describe a feature of a scatter diagram? Which of the statements is not part of the description of a scatter diagram? Which one of these types of data display preserves the identity of individual observations? What statements below describe the relative use of dot plots and histograms? The interquartile range is a measure of dispersion usually used along with the median. What is the definition of interquartile range? Dot plots allow one to observe which of the following? The mean, median and mode are all the same for which type of distribution? Most of the used cars sold by a used car dealer are priced at about $16,000. The median price of a car on the lot is $14,450 but a few sell for under $2000. The distribution of car prices is: Which of the following statements are true of the weighted mean? According to Chebyshev’s Theorem, what proportion of values for a bimodal distribution will be found within 2 standard deviations of the mean? Why is it important to consider all the measures of location in reporting statistics? Which of the following are advantages of the variance comparted to the range? In the formula for calculating the mean of the grouped data, M stands for: Which of the following are important properties of the arithmetic mean? Chebychev’s theorem states the proportion of values is at least 1=1/k^2. What is the meaning of k? What is another term for the average value of a distribution? What is the definition of a parameter? What is the variance of the following population data? [2,6,1] What is the best measure of the center of an income distribution in a country where most of the households have annual incomes of about $40,000 but some small have incomes above $1 million? Which of the following are reasons why the mode would not be a good choice of measure for describing the center of a set of data? Which one is an advantage of the std deviation over the variance? When you calculate the sample mean, you divide the sum of the values in the sample by? A statistic is: Which is the measure of dispersion results in units that are different from the data? Which of the following are used to measure dispersion? A stock is sold at $32 per share in 2006. By 2016 the price per share was $65. What was the annual rate of increase for the stock? According to Chebyshev’s theorem, what proportion of values for a bimodal distribution will be found within two standard deviations of the mean? Chapter 3 Quiz Variation describes the degree of dispersion in the data: For a data set, half of the observations are always greater than the____. In the calculation of the arithmetic mean for grouped data, which value is used to represent all the values in a particular class? The class midpoint The times (in minutes) that several underwriters took to review applications for similar insurance coverage are 50,230,52 and 57. What is the median length of time required to review an application? Extremely high or low scores affect the value of the median.: This is the weighted mean. Multiply the semester hours per class by the points earned, sum the results and divide the total A question in a market survey asks for a respondent’s favorite car color. Which measure of central location should be used to summarize this question? A disadvantage of using an arithmetic mean to summarize a set of data is that The geometric mean is the nth root of the product of n observations. : According to the Empirical rule, about 95% of the observations lie within plus and minus 2.00 standard deviations. In a company, the standard deviation of the ages of female employees is 6 years and the standard deviation of the ages of male employees is 10 years. These statistics indicate that the dispersion of age is greater for females than for males.: What is the relationship among the mean, median and mode in a symmetric distribution? : A sample of the paramedical fees charged by clinics revealed these amounts: $49, $50, $45, $52, and $55. What is the median charge? For any data set, which measures of central location have only one value?: mean and median For the most recent seven years, the U.S. Department of Education reported the following number of bachelor's degrees awarded in computer science: 4,033; 5,652; 6,407; 7,201; 8,719; 11,154; 15,121. What is the annual arithmetic mean number of degrees awarded? : A set of ordinal-, interval-, or ratio-level data may have only one mode A value that is typical or representative of the data is referred to as a measure of central location The sum of the deviations from the mean for the set of numbers 4, 9, and 5 will equal zero: For a set of data arranged or sorted in numerical order, the value of the observation in the center is called the weighted mean The mode is the value of the observation that appears most frequently What is the lowest level of measurement to which a median can be computed?: Ordinal When computing the arithmetic mean, the smallest value in the data set: Can never be negative. Other answers: can be any value, can never be less than the mean or can never be zero The variance of a sample of 121 observations equals 441. The standard deviation of the sample equals. Chapter 4 quiz The times (in minutes) that several underwriters took to review applications for similar insurance coverage are 50, 230, 52, and 57. What is the median length of time required to review an application? 54.5 To locate the percentile for a given observation in a data set, the data must be What is the possible range of values for Pearson's coefficient of skewness? -3 and + 3 The 75th percentile is referred to as the A contingency table would be used to summarize data such as ________. : In a stem-and-leaf display, the leaf represents a class of a frequency distribution.: The median of a sample will always equal the: A stem-and-leaf diagram shows the actual data values.: Quartiles divide a distribution into ___________. 4 equal parts In a contingency table, we describe the relationship between ________.: Two variables measured at the ordinal or nominal level A dot plot is useful for quickly graphing frequencies in a small data set. True A box plot shows the skewness of a distribution.: True A scatter diagram is used to illustrate a relationship between gender and the preference for Coke or Pepsi. False A scatter diagram of sales versus production is labeled with sales on the Y-axis and production on the X-axis. True A box plot graphically shows the 10th and 90th percentiles. False The 50th percentile of a distribution is the same as the distribution mean.: False If a student places in the 99th percentile on an exam, she performed better than 99% of all students who completed the exam. Her performance is similar to a statement based on a __________. Cumulative frequency distribution Define the 67th percentile.The data value that is greater than 67% of the data values. A: the value above which 67% of the observations occur. A stockbroker placed the following order for a customer: • 50 shares of Kaiser Aluminum at $104 a share • 100 shares of GTE at $25.25 a share • 20 shares of Boston Edison at $9.125 a share What is the weighted arithmetic mean price per share? $46.51 A relationship between two nominal variables is summarized by a contingency table.: TRUE A sample of experienced typists revealed that their mean typing speed is 87 words per minute and the median typing speed is 73 words per minute. The standard deviation of typing speed is 16.9 words per minute. What is the Pearson coefficient of skewness? A:+2.5 Chapter 5 Practice Questions In the Venn Diagram Shown, the area where the circles overlap is P(A and B). What is this area called? The Joint Probability of A and B Match the numerical probabilities to the statement describing the likelihood of an event. Which of the following numbers could represent a probability that an event will occur? Select all that apply. Choose the best statement that best defines the term “experiment” in the context of probability. Which of the following best describes the meaning of “outcome” in the context of a probability experiment? Which of the following is the best definition of “event” in the context of a probability experiment? Which of the following statements describe a probability? Select the methodology that would result in a Subjective probability. A: Which of the following is a Subjective Probability? Which of the following are true regarding the Special Rule of Addition and the General Rule of Addition? A: If the events A and B are mutually exclusive you can use the Special Rule of Addition. & If the events A and B are mutually exclusive, you can use the General Rule of Addition. ** If the fraction of times an event happened in the past is used as the basis for assigning a probability to the event, this is _____ probability. What is Empirical Probability?. Which of the following statements accurately repeats formula P(B)=0.30? The equation P(A)=1-P(~A) is known as the _____ rule Choose the best description of independent events. A ***Classical Probability: Probability of an event= # of favorable outcomes/ total # of possible outcomes How do you calculate classical probability? A: # of favorable outcomes/ total # of possible outcomes Which of the following expressions accurately represents the General Rule of Addition? A:*** P(A or B)=P(A) + P(B). This is the special ryle, when A and B are mutually exclusive How would you read the formula P(~A)? A: The Special Rule of Addition describes how to calculate which of the following probabilities? Which of the following is a Conditional Probability? Two events are independent if: A: The occurrence of one event does not change the likelihood that the other will occur. A table used to classify observations according to two or more identifiable characteristics and often used to determine probabilities is called a _____ table. The probability that event A will occur is forty five percent. Which of these statements correctly expresses this statement in mathematical form? The value given for an Empirical Probability is based on: A: As the number of trails increases, what does the Law of Large Numbers say about the probabilities? Suppose that P(X)=0.20, P(Y)=0.40, P(Z)= 0.25 and the events are mutually exclusive. What is the probability of A, B or C occurring? The complement Rule tells us that When you roll a die, the probability that the face with three dots will lie uppermost is 1/6. Use the complement rule to find the probability that the upper face will not be a three. Choose the best description of Joint Probability. A: Which of the following expressions accurately represents the General Rule of Addition? When you flip three coins, the probability that they will show three “heads” is 1/8. What is the probability they will not show 3 heads? A: 7/8. Let 3 heads= A. Than P(~A)=1-P(A)= 1-1/8 A bowl contains three red and four yellow marbles. You randomly select two marbles from the bowl. Which of the following is a conditional probability? Assume the second marble is drawn from the marbles remaining after the first draw. A: The probability that the second marble will be red, if the first one was yellow. In the context of Baye’s Theorem, which of the following statements best describes a Prior Probability? A: the initial probability based on the present level of knowledge. In the context of Baye’s Theorem, which of the following statements best describes a Posterior Probability? A: a revised probability based on additional information. If there are m ways of doing one thing and n ways of doing another, how many ways are there to do both? For example, if a toy in m colors and n sizes, how many different toys can there be? A: m x n -> This is called the Multiplication Rule. How would you read the formula P(~A)? a: the probability of not A. Two events are mutually exclusive if: a: the occurrence of one event means the other can’t occur at the same time P(A or B)= P(A) + P(B) For this to be true, which one of the following conditions must be met? A: Event A and event B must not be able to occur at the same time. That is, they are mutually exclusive. What is the assumption upon which classical probability is based? A: that the outcomes of an experiment are equally likely. Which one of the following is true about events that are both mutually exclusive and collectively exhaustive>? A: The sum of their probabilities must be 1. Which of the following formulas correctly represents the general rule of multiplication for two events? A: P(A and B)= P(A)P(B|A) What does it mean when an experiment has a set of events that are collectively exhaustive? A: that at least one of the events must occur. Which one of the following is a characteristic of the classical approach to probability? A: probabilities assume outcomes of an experiment are equally likely. Which one of the following conditions must be met to use the Special Rule of Addition? I.e. P(A or B)= P(A) + P(B)…A: the events A and B must be mutually exclusive Identical prizes are to be given to two winners from a group of 12 contestants. What counting formula would you use to determine how many ways the prizes could be given out? A: combination formula What is the purpose of using selection with replacement? A: the probabilities do not change from one trail to another. Each experiment uses the same set of events. Chapter 6 Practice Activity A binomial distribution has 8 trails and a probability of success of 0.2. Calculate the variance for the distribution. A: 1.28 True or false: The std deviation of a probability distribution is the sq root of the variance of the probability distribution. A: true From the following list, choose the random variables that are continuous. Select all that apply.; A: The tire pressure in a randomly selected automobile & the average annual return on a certain bond. A quantity representing the outcome of a random experiment that can assume different values is called a: PROBABILTIY Which of the following statements describe the Poisson Distribution? The random variable is the # of occurrences during an interval. The intervals do not overlap and are independent. The probability of the event is proportional to the interval size. Which of the following statements best describes a Probability Distribution? A: A list of the outcomes of a random experiment and the probability of each outcome Under what circumstances should you use the hypergeometric distribution instead of the binomial distribution? A: When the sample size is more than 5%$ of the population so that the trails are independent.. n/N > 0.05 Choose the random variables from this set that are discrete. A: The number of dots uppermost of rolling a pair of dice. & # of drive-thru customers to the bank on a given day. Choose the two random variables from this list that are continuous: The average temperature in NYC during May. & The wait time at a dentist. ***********probability distribution formula In a binomial experiment the variable is the number of successes in a fixed # of trails and the probability of success is the same for each trail. Which two of the following statements also describe features of a binomial experiment A: The outcome of a trail can be classified as either a success or a failure. & trails are independent. A random variable can be defined as: a quantity resulting from a random experiment that can have different values What shows the possible outcomes of a random experiment and the probability of each outcome? A: a probability distribution Choose the statements that describe characteristics of a probability distribution. A: the probability of an outcome is between 0 and 1. The outcomes are mutually exclusive events. The sum of the probabilities of all possible outcome is one. A binomial experiment has independent trails and the outcome of a trail can be classified as either a success of a failure. Which two of the following statements also describe features of a binomial experiment? A: the probability of success stays the same for each trail. & the random variable counts the number of successes in a fixed number of trials. Is it easier to use a binomial probability table instead of calculating the probability under what circumstances? A: When n is large. Which of the following statements describes the relationship between the Poisson distribution and the binomial distribution? A: It is a limiting form of the binomial distribution when the probability of success (PI) is very small and the sample (n) is very large. Choose the random variables form this set that are discrete. A: The # of concert tickets sold and the # of persons riding on a bus. When can a binomial distribution be used as a good approximation to a hypergeometric distribution? A: When the sample size (n) is less than 5% of the population. This will mean that the samples are almost independent. ***Hypergeometric distribution: We are sampling, without replacement, from a small population, so the trails are dependent. Is it easier to use a binomial probability table instead of calculating the probability under what circumstances? A: When n is large. Chapter 5 Quiz ( 10, 14, 16 and 19) Using the terminology of Bayes’ Theorem, a posterior probability can also be defined as: A: revised probability In a finance class, the final grade is based on three tests. Historically, the instructor tells the class that the joint probability of scoring As on the first two tests is 0.5. A student assigns a probability of 0.9 that she will get an A on the first test. What is the probability that the student will score an A on the second test given that she scored an A on the first test? A: 0.56….or 0.95, 0.90 or 0.50 What does the complement rule state? A: The process used to calculate the revised probability of an event given additional information can be obtained through____. A: bayes’ theorem orrr permutation, subjective probability, classical probability. Probablities are important information when_____. A: Applying descriptive statistics A joint probability measures the likelihood that two or more events will happen concurrently. A: TRUE A survey of top executives revealed that 35% of them regularly read Time magazine, 20% read Newsweek, and 40% read U.S. News & World Report. A total of 10% read both Time and U.S. News & World Report. What is the probability that a particular top executive reads either Time or U.S. News & World Report regularly? A: 0.65 When an event’s probability depends on the occurrence of another event, the probability is an______. A: conditional probability A method of assigning probabilities based upon judgement, opinions and available information is reffered to as the_____. A: Subjective method orr classical, probability or empirical Bayes; theorem is a method to revise the probability of an event given additional information. TRUE When an experiment is conducted “without replacement”_______. A: events are dependent If two events A and B are mutually exclusive, what does the special rule of addition state? A: P(A or B)= P(A) + P(B) The probability of rolling a 3 or 2 on a single die is an example of mutually exclusive events. A: TRUE Which approach to probability assumes that events are equally likely? A: CLASSICAL If two events are independent, then their joint probability is computed with _______. A: computed with the special rule of multiplication The probability of two or more events occurring concurrently is called a(n) _______. A: Joint probability or conditional, empirical or tree diagram The result of a particular experiment is called a(n) ___________. A: OUTCOME Bayes' theorem is used to calculate a subjective probability. A: FALSE An experiment may have_____. A: one or more outcomes. When are two experimental outcomes mutually exclusive? A: When the joint probability of the two outcomes it not equal to zero., if two events are mutually exclusive, then P(A and B) = P(A) × P(B). A: FALSE A study of 200 computer service firms revealed these incomes after taxes: Income After Taxes Number of Firms Under $1 million 102 $1 million up to $20 million 61 $20 million and more 37 What is the probability that a particular firm selected has $1 million or more in income after taxes? A: 0.49 A) 0.00 B) 0.25 C) 0.49 D) 0.51 Probabilities are important information when __________. Applying descriptive statistics What does the complement rule state? A: P(A) = 1 − P(not A) Bayes' theorem is a method to revise the probability of an event given additional information. TRUE When an experiment is conducted "without replacement," _______. the probability of two or more events is computed as a joint probability ? If two events A and B are mutually exclusive, what does the special rule of addition state? P(A and B) = P(A) + P(B) Chapter 6 Quiz [Attempt #1] An experiment consists of making 80 phone calls in order to sell a particular insurance policy. The random variable in this experiment is a _____. A: discrete random variable Which of the following is a requirement for use of the hypergeometric distribution? A: Only two possible outcomes The probability of a particular outcome must always be between 0.0 and 1.0 inclusive. A:TRUE The variance measures the skewness of a probability distribution. A: FALSE When sampling is done without replacement from a finite population and the outcomes are measured as either a success or failure, the hypergeometric distribution should be applied. A: TRUE To construct a binomial distribution, it is necessary to know the total number of trials and the probability of success on each trial. A: TRUE What must you know to develop a binomial probability distribution? A: The probability of success and the number of trails In a Poisson distribution, the probability of success may vary from trial to trial. A: FALSE As a general rule of thumb, if the items selected for a sample are not replaced and the sample size is less than 5% of the population, the binomial distribution can be used to approximate the hypergeometric distribution. A: TRUE To construct a binomial distribution, it is necessary to know the total number of trials and the probability of success on each trial. A: TRUE A random variable represents the outcome of an experiment. A: TRUE A machine shop has 100 drill presses and other machines in constant use. The probability that a machine will become inoperative during a given day is 0.002. During some days, no machines are inoperative, but on other days, one, two, three, or more are broken down. What is the probability that fewer than two machines will be inoperative during a particular day? A: 0.9824 [Poisson Distribution Formula] Which one of the following is NOT a condition of the binomial distribution? A: Sampling at least 10 trails. [Yes would be the probability of success remains constant from trail to trail, independent trails and only two outcomes A probability distribution is a mutually exclusive and collectively exhaustive listing of experimental outcomes that can occur by chance, and their corresponding probabilities. A: TRUE if the variance is 3.6 grams, what is the standard deviation? A: 1.897 Data show that the weight of an offensive linesman may be any weight between 200 and 350 pounds. The distribution of weight is based on a ______________. A: Continuous random variable A company is studying the number of monthly absences among its 125 employees. The following probability distribution shows the likelihood that people were absent 0, 1, 2, 3, 4, or 5 days last month. Given the probability distribution, which of the following predictions is correct? A: There is a 0.12 probability that an employee will be absent two days per month A coin is tossed three times. The following table summarizes the experiment. What is the following table called? A: This is a probability distribution. The outcomes are collectively exhaustive and mutually exclusive; the probabilities of the outcomes are between 0 and 1 and sum up to 1. A company is studying the number of monthly absences among its 125 employees. The following probability distribution shows the likelihood that people were absent 0, 1, 2, 3, 4, or 5 days last month. What is the mean number of days absent? A: 0.72 days A company is studying the number of monthly absences among its 125 employees. The following probability distribution shows the likelihood that people were absent 0, 1, 2, 3, 4, or 5 days last month. Number of Days Absent Probability 0 0.60 1 0.20 2 0.12 3 0.04 4 0.04 5 0.00 What is the mode of the distribution? A: 0 Days Which of the following is NOT a characteristic of a binomial probability distribution? A:The number of trails is limited to two. A measure of the long-run average value of a random variable used to represent the central location of a probability distribution is called a(n)______. A: Expected value The variance of a probability distribution is based on the sum of squared differences from the mean multiplied by the probability of X. A: TRUE To construct a binomial distribution, it is necessary to know the total number of trials and the probability of success on each trial. A: TRUE Chapter 7 Quiz The z score for the standard normal distribution A: can be either negative or positive if an average of 12 customers are served per hour, then one customer arrives every ________. A: 5 minutes Tables of normal distribution probabilities are found in many statistics books. These probabilities are calculated from a normal distribution with ___________. A: A mean of 0 and a standard deviation of 1 A normally distributed random variable has _________. A: any value between – infinity and + infinity When referring to the normal probability distribution, there is not just one; there is a "family" of normal probability distributions. A: TRUE The time to fly between New York City and Chicago is uniformly distributed with a minimum of 120 minutes and a maximum of 150 minutes. What is the probability that a flight is more than 140 minutes? A: 0.333 The time to fly between New York City and Chicago is uniformly distributed with a minimum of 120 minutes and a maximum of 150 minutes. What is the probability that a flight is between 125 and 140 minutes? A: 0.50 Some normal probability distributions are positively skewed. A: FALSE The mean of any uniform probability distribution is _________. (a+b)/2 The average starting salary of individuals with a master's degree in statistics is normally distributed with a mean of $48,000 and a standard deviation of $6,000. What is the probability that a randomly selected individual with a master's in statistics will get a starting salary of at least $55,000? A: 0.121 The upper and lower limits of a uniform probability distribution are __________. A: the maximum and minimum values of the random variable. For the exponential distribution, the mean and standard deviation are equal. A: TRUE The time to fly between New York City and Chicago is uniformly distributed with a minimum of 120 minutes and a maximum of 150 minutes. What is the distribution's standard deviation? A: 8.66 minutes if an average of 60 customers are served per hour, then one customer arrives every ________. A: 1 minute new extended-life light bulb has an average life of 750 hours, with a standard deviation of 50 hours. If the life of these light bulbs approximates a normal distribution, about what percent of the distribution will be between 600 hours and 900 hours? A: 99.7% The time to fly between New York City and Chicago is uniformly distributed with a minimum of 120 minutes and a maximum of 150 minutes. What is the probability that a flight is less than 135 minutes? A: 0.50 The standard normal distribution is a special normal distribution with a mean of 0 and a standard deviation of 1. A: TRUE The exponential distribution is a probability distribution for a random variable measured as a rate of an event occurring. A: TRUE A "continuity correction factor" is used to compute probabilities when using the normal distribution to approximate the binomial distribution. A: TRUE The normal distribution can be used to approximate a binomial distribution when nπ is less than 5. A: FALSE The number of different standard normal distributions is unlimited. A: FALSE *** Which of the following is a characteristic of the normal probability distribution? A: It’s bell-shaped. Which of the following is true in a normal distribution? A: The mean divides the distribution into two equal areas. The center of a normal probability distribution is ________. A: The mean of the distribution Which of the following is true regarding the normal distribution? A: The mean, median and mode are all equal. Chapter 8 Quiz a using crash tests, a sample of one or two cars is used because ___________ A: Cars are destroyed The Office of Student Services at a large western state university maintains information on the study habits of its full-time students. Their studies indicate that the mean amount of time undergraduate students study per week is 20 hours. The hours studied follows the normal distribution with a population standard deviation of six hours. Suppose we select a random sample of 144 current students. What is the probability that the mean of this sample is less than 19.25 hours? A: (C) 0.0668 The standard error of the mean measures the dispersion of the sampling distribution of the sample mean. A: TRUE A marketing firm is studying consumer preferences for winter fashions in four different months. From a population of women 18 to 21 years of age, a random sample of 100 women was selected in January. Another random sample of 100 women was selected in March. Another random sample of 100 women was selected in June. Another random sample of 100 women was selected in September. What is the sample size A: 100 Sampling a population is often necessary because the cost of studying all the items in the population is prohibitive. A: TRUE To study the population of consumer perceptions of new technology, sampling of the population is preferred over surveying the population because _________. A: It is quicker. When all the items in a population have an equal chance of being selected for a sample, the process is called _________________. A: Simple Random Sampling We can expect some difference between sample statistics and the corresponding population parameters. This difference is called the sampling error. A: TRUE What is the difference between a sample mean and the population mean called? A: Sampling Error A sampling distribution of the means is a probability distribution consisting of all possible sample means of a given sample size selected from a population. A: TRUE In cluster sampling, a population is divided into subgroups called clusters, and a sample is randomly selected from each cluster. A: False The Office of Student Services at a large western state university maintains information on the study habits of its full-time students. Their studies indicate that the mean amount of time undergraduate students study per week is 20 hours. The hours studied follows the normal distribution with a population standard deviation of six hours. Suppose we select a random sample of 144 current students. What is the probability that the mean of this sample is between 19 hours and 20 hours? A: 0.4772 Manufacturers were subdivided into groups by volume of sales. Those with more than $100 million in sales were classified as large; those from $50 to $100 million as medium size; and those between $25 and $50 million, and so on. Samples were then selected from each of these groups. What is this type of sampling called? A: Stratified random sampling The true sampling error is usually not known because ________. A: µ is unknown When using stratified random sampling, the sampling error will be zero. A: FALSE In stratified random sampling, a population is divided into strata using naturally occurring geographic or other boundaries. Then, strata are randomly selected and a random sample is collected from each strata. A: FALSE If 40 samples of size 21 were selected from a population of 22,493, we would expect the mean of the sample means and the population mean to be close but not exactly equal. A: TRUE The standard error of the mean is also called the sampling error. A: FALSE It is often not feasible to study the entire population because it is impossible to observe all the items in the population. A: TRUE The items or individuals of the population are arranged in a file drawer alphabetically by date received. A random starting point is selected and then every kth member of the population is selected for the sample. This sampling method is called systematic random sampling. A: TRUE When dividing a population into subgroups so that a random sample from each subgroup can be collected, what type of sampling is used? A: Stratified random sampling Bones Brothers & Associates prepare individual tax returns. Over prior years, Bones Brothers has maintained careful records regarding the time to prepare a return. The mean time to prepare a return is 90 minutes, and the population standard deviation of this distribution is 14 minutes. Suppose 100 returns from this year are selected and analyzed regarding the preparation time. What is the probability that the mean time for the sample of 100 returns is between 88 minutes and 92 minutes? A: 0.8472 ***According to the central limit theorem, ____________. A: the sampling distribution of the sample means will be skewed or increasing the sample size decreases the dispersion of the sampling distribution ***When deciding to collect sample information rather than collecting information from the population, the amount of time required to collect the information is unimportant. A: TRUE Chapter 9 Quiz The mean weight of trucks traveling on a particular section of I-475 is not known. A state highway inspector needs an estimate of the population mean. He selects and weighs a random sample of 49 trucks and finds the mean weight is 15.8 tons. The population standard deviation is 3.8 tons. What is the 95% confidence interval for the population mean? A: 14.7 and 16.9 A group of statistics students decided to conduct a survey at their university to find the average (mean) amount of time students spent studying per week. Assuming a population standard deviation of six hours, what is the required sample size if the error should be less than a half hour with a 95% level of confidence?A: 554 A research firm needs to estimate within 3% the proportion of junior executives leaving large manufacturing companies within three years. A 0.95 degree of confidence is to be used. Several years ago, a study revealed that 21% of junior executives left their company within three years. To update this study, how many junior executives should be surveyed? A: 709 A sample standard deviation is the best point estimate of the ___________. A: Population Standard Deviation When a confidence interval for a population mean is constructed from sample data, __________. A: We can conclude that the population mean is in the interval The finite population correction (FPC) factor is used to adjust the z-statistic or t-statistic. A: False…not for the Z-statistic A confidence interval for a population mean __________. A: estimates a likely interval for a population mean Knowing the population standard deviation, a 95% confidence interval infers that the population mean ___________. A: is within +- 1.96 standard errors of the sample mean The population variation has little or no effect in determining the size of a sample selected from the population. A: FALSE A local retail company wants to estimate the mean amount spent by customers. Their store's budget limits the number of surveys to 225. What is their maximum error of the estimated mean amount spent for a 99% level of confidence and an estimated standard deviation of $10.00? A: $1.72 A survey of 25 grocery stores revealed that the mean price of a gallon of milk was $2.98, with a standard error of $0.10. If 90% and 95% confidence intervals were developed to estimate the true cost of a gallon of milk, what similarities would they have?A: (point estimates and standard error… chose Both use the same point estimate of the population mean A local company wants to evaluate their quality of service by surveying their customers. Their budget limits the number of surveys to 100. What is their maximum error of the estimated mean quality for a 95% level of confidence and an estimated standard deviation of 5? A: 0.9920…choose 0.98 When using Student's t to compute an interval estimate, ___________. A: we assume that the samples are collected from normally distributed populations A point estimate is a range of values used to estimate a population parameter. A: FALSE The distribution of Student's t is ________. A: Symmetrical The distribution of Student's t has _________. A: a mean of zero and a standard deviation that depends on the sample size One factor in determining the size of a sample is the degree of confidence selected. This is usually 0.95 or 0.99, but it may be any degree of confidence you specify. A: TRUE A point estimate is a single value used to estimate a population parameter. A: TRUE An interval estimate is a single value used to estimate a population parameter. A: FALSE An interval estimate is a range of values in which the population parameter is likely to occur. A: #5- TRUE The 95% confidence interval states that 95% of the sample means of a specified sample size selected from a population will lie within plus and minus 1.96 standard deviations of the hypothesized population mean. A: #9-TRUE The finite population correction factor is applied when the population size is known. A: #10 TRUE A sample mean is the best point estimate of______. A: Population Mean A z-statistic is used for a problem involving any sample size and an unknown population standard deviation. A: FALSE How is the t-distribution similar to the standard z-distribution? A: #25 should be continuous and bell shaped. But best answer is : BOTH are continuous distributions Chapter 7 Quiz The z score for the standard normal distribution A: can be either negative or positive if an average of 12 customers are served per hour, then one customer arrives every ________. A: 5 minutes Tables of normal distribution probabilities are found in many statistics books. These probabilities are calculated from a normal distribution with ___________. A: A mean of 0 and a standard deviation of 1 A normally distributed random variable has _________. A: any value between – infinity and + infinity When referring to the normal probability distribution, there is not just one; there is a "family" of normal probability distributions. A: TRUE The time to fly between New York City and Chicago is uniformly distributed with a minimum of 120 minutes and a maximum of 150 minutes. What is the probability that a flight is more than 140 minutes? A: 0.333 The time to fly between New York City and Chicago is uniformly distributed with a minimum of 120 minutes and a maximum of 150 minutes. What is the probability that a flight is between 125 and 140 minutes? A: 0.50 Some normal probability distributions are positively skewed. A: FALSE The mean of any uniform probability distribution is _________. (a+b)/2 The average starting salary of individuals with a master's degree in statistics is normally distributed with a mean of $48,000 and a standard deviation of $6,000. What is the probability that a randomly selected individual with a master's in statistics will get a starting salary of at least $55,000? A: 0.121 The upper and lower limits of a uniform probability distribution are __________. A: the maximum and minimum values of the random variable. For the exponential distribution, the mean and standard deviation are equal. A: TRUE The time to fly between New York City and Chicago is uniformly distributed with a minimum of 120 minutes and a maximum of 150 minutes. What is the distribution's standard deviation? A: 8.66 minutes if an average of 60 customers are served per hour, then one customer arrives every ________. A: 1 minute new extended-life light bulb has an average life of 750 hours, with a standard deviation of 50 hours. If the life of these light bulbs approximates a normal distribution, about what percent of the distribution will be between 600 hours and 900 hours? A: 99.7% The time to fly between New York City and Chicago is uniformly distributed with a minimum of 120 minutes and a maximum of 150 minutes. What is the probability that a flight is less than 135 minutes? A: 0.50 The standard normal distribution is a special normal distribution with a mean of 0 and a standard deviation of 1. A: TRUE The exponential distribution is a probability distribution for a random variable measured as a rate of an event occurring. A: TRUE A "continuity correction factor" is used to compute probabilities when using the normal distribution to approximate the binomial distribution. A: TRUE The normal distribution can be used to approximate a binomial distribution when nπ is less than 5. A: FALSE The number of different standard normal distributions is unlimited. A: FALSE *** Which of the following is a characteristic of the normal probability distribution? A: It’s bell-shaped. Which of the following is true in a normal distribution? A: The mean divides the distribution into two equal areas. The center of a normal probability distribution is ________. A: The mean of the distribution Which of the following is true regarding the normal distribution? A: The mean, median and mode are all equal. Chapter 8 Quiz a using crash tests, a sample of one or two cars is used because ___________ A: Cars are destroyed The Office of Student Services at a large western state university maintains information on the study habits of its full-time students. Their studies indicate that the mean amount of time undergraduate students study per week is 20 hours. The hours studied follows the normal distribution with a population standard deviation of six hours. Suppose we select a random sample of 144 current students. What is the probability that the mean of this sample is less than 19.25 hours? A: (C) 0.0668 The standard error of the mean measures the dispersion of the sampling distribution of the sample mean. A: TRUE A marketing firm is studying consumer preferences for winter fashions in four different months. From a population of women 18 to 21 years of age, a random sample of 100 women was selected in January. Another random sample of 100 women was selected in March. Another random sample of 100 women was selected in June. Another random sample of 100 women was selected in September. What is the sample size A: 100 Sampling a population is often necessary because the cost of studying all the items in the population is prohibitive. A: TRUE To study the population of consumer perceptions of new technology, sampling of the population is preferred over surveying the population because _________. A: It is quicker. When all the items in a population have an equal chance of being selected for a sample, the process is called _________________. A: Simple Random Sampling We can expect some difference between sample statistics and the corresponding population parameters. This difference is called the sampling error. A: TRUE What is the difference between a sample mean and the population mean called? A: Sampling Error A sampling distribution of the means is a probability distribution consisting of all possible sample means of a given sample size selected from a population. A: TRUE In cluster sampling, a population is divided into subgroups called clusters, and a sample is randomly selected from each cluster. A: False The Office of Student Services at a large western state university maintains information on the study habits of its full-time students. Their studies indicate that the mean amount of time undergraduate students study per week is 20 hours. The hours studied follows the normal distribution with a population standard deviation of six hours. Suppose we select a random sample of 144 current students. What is the probability that the mean of this sample is between 19 hours and 20 hours? A: 0.4772 Manufacturers were subdivided into groups by volume of sales. Those with more than $100 million in sales were classified as large; those from $50 to $100 million as medium size; and those between $25 and $50 million, and so on. Samples were then selected from each of these groups. What is this type of sampling called? A: Stratified random sampling The true sampling error is usually not known because ________. A: µ is unknown When using stratified random sampling, the sampling error will be zero. A: FALSE In stratified random sampling, a population is divided into strata using naturally occurring geographic or other boundaries. Then, strata are randomly selected and a random sample is collected from each strata. A: FALSE If 40 samples of size 21 were selected from a population of 22,493, we would expect the mean of the sample means and the population mean to be close but not exactly equal. A: TRUE The standard error of the mean is also called the sampling error. A: FALSE It is often not feasible to study the entire population because it is impossible to observe all the items in the population. A: TRUE The items or individuals of the population are arranged in a file drawer alphabetically by date received. A random starting point is selected and then every kth member of the population is selected for the sample. This sampling method is called systematic random sampling. A: TRUE When dividing a population into subgroups so that a random sample from each subgroup can be collected, what type of sampling is used? A: Stratified random sampling Bones Brothers & Associates prepare individual tax returns. Over prior years, Bones Brothers has maintained careful records regarding the time to prepare a return. The mean time to prepare a return is 90 minutes, and the population standard deviation of this distribution is 14 minutes. Suppose 100 returns from this year are selected and analyzed regarding the preparation time. What is the probability that the mean time for the sample of 100 returns is between 88 minutes and 92 minutes? A: 0.8472 ***According to the central limit theorem, ____________. A: the sampling distribution of the sample means will be skewed or increasing the sample size decreases the dispersion of the sampling distribution ***When deciding to collect sample information rather than collecting information from the population, the amount of time required to collect the information is unimportant. A: TRUE Chapter 9 Quiz The mean weight of trucks traveling on a particular section of I-475 is not known. A state highway inspector needs an estimate of the population mean. He selects and weighs a random sample of 49 trucks and finds the mean weight is 15.8 tons. The population standard deviation is 3.8 tons. What is the 95% confidence interval for the population mean? A: 14.7 and 16.9 A group of statistics students decided to conduct a survey at their university to find the average (mean) amount of time students spent studying per week. Assuming a population standard deviation of six hours, what is the required sample size if the error should be less than a half hour with a 95% level of confidence?A: 554 A research firm needs to estimate within 3% the proportion of junior executives leaving large manufacturing companies within three years. A 0.95 degree of confidence is to be used. Several years ago, a study revealed that 21% of junior executives left their company within three years. To update this study, how many junior executives should be surveyed? A: 709 A sample standard deviation is the best point estimate of the ___________. A: Population Standard Deviation When a confidence interval for a population mean is constructed from sample data, __________. A: We can conclude that the population mean is in the interval The finite population correction (FPC) factor is used to adjust the z-statistic or t-statistic. A: False…not for the Z-statistic A confidence interval for a population mean __________. A: estimates a likely interval for a population mean Knowing the population standard deviation, a 95% confidence interval infers that the population mean ___________. A: is within +- 1.96 standard errors of the sample mean The population variation has little or no effect in determining the size of a sample selected from the population. A: FALSE A local retail company wants to estimate the mean amount spent by customers. Their store's budget limits the number of surveys to 225. What is their maximum error of the estimated mean amount spent for a 99% level of confidence and an estimated standard deviation of $10.00? A: $1.72 A survey of 25 grocery stores revealed that the mean price of a gallon of milk was $2.98, with a standard error of $0.10. If 90% and 95% confidence intervals were developed to estimate the true cost of a gallon of milk, what similarities would they have?A: (point estimates and standard error… chose Both use the same point estimate of the population mean A local company wants to evaluate their quality of service by surveying their customers. Their budget limits the number of surveys to 100. What is their maximum error of the estimated mean quality for a 95% level of confidence and an estimated standard deviation of 5? A: 0.9920…choose 0.98 When using Student's t to compute an interval estimate, ___________. A: we assume that the samples are collected from normally distributed populations A point estimate is a range of values used to estimate a population parameter. A: FALSE The distribution of Student's t is ________. A: Symmetrical The distribution of Student's t has _________. A: a mean of zero and a standard deviation that depends on the sample size One factor in determining the size of a sample is the degree of confidence selected. This is usually 0.95 or 0.99, but it may be any degree of confidence you specify. A: TRUE A point estimate is a single value used to estimate a population parameter. A: TRUE An interval estimate is a single value used to estimate a population parameter. A: FALSE An interval estimate is a range of values in which the population parameter is likely to occur. A: #5- TRUE The 95% confidence interval states that 95% of the sample means of a specified sample size selected from a population will lie within plus and minus 1.96 standard deviations of the hypothesized population mean. A: #9-TRUE The finite population correction factor is applied when the population size is known. A: #10 TRUE A sample mean is the best point estimate of______. A: Population Mean A z-statistic is used for a problem involving any sample size and an unknown population standard deviation. A: FALSE How is the t-distribution similar to the standard z-distribution? A: #25 should be continuous and bell shaped. But best answer is : BOTH are continuous distributions Chapter 10 Quiz 88% What are the critical values for a two-tailed test with a 0.01 level of significance when n is large and the population standard deviation is known? A: Above 2.576 and below -2.576 The level of significance is the probability of rejecting the null hypothesis when it is actually true. A: True A manufacturer wants to increase the shelf life of a line of cake mixes. Past records indicate that the average shelf life of the mix is 216 days. After a revised mix has been developed, a sample of nine boxes of cake mix gave these shelf lives (in days): 215, 217, 218, 219, 216, 217, 217, 218, and 218. Using α = 0.025, has the shelf life of the cake mix increased? A: Yes, because computed t is greater than the critical value What is the probability of making a Type II error if the null hypothesis is actually true? A: 0 For a one-tailed hypothesis test, the critical z-value of the test statistic is −2.33. Which of the following is true about the hypothesis test? The probability of a Type II error is represented by the Greek symbol β. A: TRUE For a two-tailed test at the 0.05 significance level, what is the rejection region when n if large and the population standard deviation is known? A: Greater than +1.96 and less than – 1.96 A hypothesis regarding the weight of newborn infants at a community hospital is that the mean is 6.6 pounds. A sample of seven infants is randomly selected and their weights at birth are recorded as 9.0, 7.3, 6.0, 8.8, 6.8, 8.4, and 6.6 pounds. What is the sample variance? A: 1.386 Consider a right-tailed test (upper tail) and a sample size of 40 at the 95% confidence level. The value of t is _______. A: +1.685 A random sample of size 15 is selected from a normal population. The population standard deviation is unknown. Assume that a two-tailed test at the 0.10 significance level is to be used. For what value of t will the null hypothesis not be rejected? A: To the left of –1.761 or to the right of 1.761 or Between -1.761 and 1.761 If the critical z-value for a hypothesis test equals 2.45, what value of the test statistic would provide the least chance of making a Type I error? A: 3.74 What are the critical z-values for a two-tailed hypothesis test if α = 0.01? A: + or – 2.576 A hypothesis regarding the weight of newborn infants at a community hospital is that the mean is 6.6 pounds. A sample of seven infants is randomly selected and their weights at birth are recorded as 9.0, 7.3, 6.0, 8.8, 6.8, 8.4, and 6.6 pounds. What is the decision for a statistical significant change in average weights at birth at the 5% level of significance? A: Fail to reject the null hypothesis Sales at a fast-food restaurant average $6,000 per day. The restaurant decided to introduce an advertising campaign to increase daily sales. To determine the effectiveness of the advertising campaign, a sample of 49 days of sales were taken. They found that the average daily sales were $6,400 per day. From past history, the restaurant knew that its population standard deviation is about $1,000. The value of the test statistic is _______. A: The test statistic is z = (6000 - 6400)/(1000/√49) = 2.80. Which symbol represents a test statistic used to test a hypothesis about a population mean? A: z The average cost of tuition plus room and board at small private liberal arts colleges is reported to be $8,500 per term, but a financial administrator believes that the average cost is higher. A study conducted using 350 small liberal arts colleges showed that the average cost per term is $8,745. The population standard deviation is $1,200. Let α = 0.05. What is the p-value for this test? A: 0.0000 The mean annual incomes of certified welders are normally distributed with the mean of $50,000 and a standard deviation of $2,000. The ship building association wishes to find out whether their welders earn more or less than $50,000 annually. The alternate hypothesis is that the mean is not $50,000. Which of the following is the alternate hypothesis? A: H1: µ ≠ $50,000 For a one-tailed test with a 0.05 level of significance, the critical z-statistic is 1.645, but the critical t-statistic is 1.96. A: False Consider a two-tailed test with a level of confidence of 80.30%. The z-value is ________. A: 1.29 Define the level of significance. A: It is the probability of a Type I error. ***the probability of a Type I error; a benchmark against which the P-value compared to determine if the null hypothesis will be rejected A p-value is a probability. A: TRUE The probability of a Type II error is directly related to _______. A: the difference between the hypothesized mean and the sample mean ***Sales at a fast-food restaurant average $6,000 per day. The restaurant decided to introduce an advertising campaign to increase daily sales. To determine the effectiveness of the advertising campaign, a sample of 49 days of sales were taken. They found that the average daily sales were $6,300 per day. From past history, the restaurant knew that its population standard deviation is about $1,000. If the level of significance is 0.05, have sales increased as a result of the advertising campaign? A: For a one-tailed hypothesis test, the critical z-value of the test statistic is −2.33. Which of the following is true about the hypothesis test? A: alpha=0.01 for a lower-tailed test Chapter 11 Quiz Twenty randomly selected statistics students were given 15 multiple choice questions and 15 open-ended questions, all on the same material. The professor was interested in determining if students scored higher on the multiple choice questions. This experiment is an example of _______. A: a paired t-test A company is researching the effectiveness of a new website design to decrease the time to access a website. Five website users were randomly selected, and their times (in seconds) to access the website with the old and new designs were recorded. To compare the times, they computed new website design time − old website design time. The results follow. User Old Website Design New Website Design A 30 25 B 45 30 C 25 20 D 32 30 E 28 27 What is the alternative hypothesis? A: H1: µd > 0 The results of a mathematics placement exam at two different campuses of Mercy College follow: Campus Sample Size Sample Mean Population Standard Deviation 1 330 33 8 2 310 31 7 Given that the two population standard deviations are known, what is the p-value? A: 0.0 Which condition must be met to conduct a test for the difference in two sample means using a z-statistic? A: the two population standard deviations must be known. When testing the difference between two population means, the sample variances are pooled to estimate the population variance when _______. A: the population variances are assumed equal but unknown When is it appropriate to use the paired difference t-test? A: When two dependent samples are compared 17. Use the following table to determine whether or not there is a significant difference between the average hourly wages at two manufacturing companies. Manufacture 1 Manufacturer 2 n1 = 81 n2 = 64 x1=$15.80x1=$15.80 x2=$15.00x2=$15.00 σ1 = $3.00 σ2 = $2.25 What is the test statistic for the difference between the means? A: 1.83 A company is researching the effectiveness of a new website design to decrease the time to access a website. Five website users were randomly selected, and their times (in seconds) to access the website with the old and new designs were recorded. To compare the times, they computed new website design time − old website design time. The results follow. User Old Website Design New Website Design A 30 25 B 45 30 C 25 20 D 32 30 E 28 27 For a 0.01 significance level, what is the critical value? A: 3.747 A recent study focused on the number of times men and women send a Twitter message in a day. The information is summarized here. Sample Size Sample Mean Population Standard Deviation Men 25 23 5 Women 30 28 10 At the 0.01 significance level, we ask if there is a difference in the mean number of times men and women send a Twitter message in a day. What is the p-value for this hypothesis test? A: 0.0164 A national manufacturer of ball bearings is experimenting with two different processes for producing precision ball bearings. It is important that the diameters be as close as possible to an industry standard. The output from each process is sampled, and the average error from the industry standard is measured in millimeters. The results are presented here. Process A Process B Sample mean 2.0 3.0 Standard deviation 1.0 0.5 Sample size 12 14 The researcher is interested in determining whether there is evidence that the two processes yield different average errors. The population standard deviations are unknown but are assumed equal. What are the degrees of freedom? A: 24 An investigation of the effectiveness of a training program to improve customer relationships included a pre-training and a post-training customer survey. To compare the differences they computed post-training survey score − pre-training survey score. Seven customers were randomly selected and completed both surveys. The results are shown here. Customer Pre-training Survey Post-training Survey A 6 8 B 5 5 C 10 10 D 7 10 E 6 8 F 5 6 G 2 8 What is the value of the test statistic? A: 2.542 A national manufacturer of ball bearings is experimenting with two different processes for producing precision ball bearings. It is important that the diameters be as close as possible to an industry standard. The output from each process is sampled, and the average error from the industry standard is measured in millimeters. The results are presented here. Process A Process B Sample mean 2.0 3.0 Standard deviation 1.0 0.5 Sample size 12 14 The researcher is interested in determining whether there is evidence that the two processes yield different average errors. The population standard deviations are unknown but are assumed equal. What is the null hypothesis? A: H0: µA ≤ µB A company is researching the effectiveness of a new website design to decrease the time to access a website. Five website users were randomly selected, and their times (in seconds) to access the website with the old and new designs were recorded. To compare the times, they computed new website design time − old website design time. The results are shown here. User Old Website Design New Website Design A 30 25 B 45 30 C 25 20 D 32 30 E 28 27 What is the value of the test statistic? A: 2.256 Accounting procedures allow a business to evaluate its inventory costs based on two methods: LIFO (last in first out) or FIFO (first in first out). A manufacturer evaluated its finished goods inventory (in $000s) for five products with the LIFO and FIFO methods. To analyze the difference, they computed FIFO − LIFO for each product. We would like to determine if the LIFO method results in a lower cost of inventory than the FIFO method. Product FIFO (F) LIFO (L) 1 225 221 2 119 100 3 100 113 4 212 200 5 248 245 What is the value of calculated t? A: +0.933 An investigation of the effectiveness of a training program to improve customer relationships included a pre-training and a post-training customer survey. To compare the differences they computed post-training survey score − pre-training survey score. Seven customers were randomly selected and completed both surveys. The results are shown here. Customer Pre-training Survey Post-training Survey A 6 8 B 5 5 C 10 10 D 7 10 E 6 8 F 5 6 G 2 8 For a 0.05 significance level, what is the critical value? A: 1.943 A recent study focused on the amount of money single men and women save monthly. The information is summarized here. Assume that the population standard deviations are equal. Sample Size Sample Mean Population Standard Deviation Men 25 23 5 Women 30 28 10 At the 0.01 significance level, do women save more money than men? What is the critical value for this hypothesis test? A: +(2.40) 2.369 ~ A national manufacturer of ball bearings is experimenting with two different processes for producing precision ball bearings. It is important that the diameters be as close as possible to an industry standard. The output from each process is sampled, and the average error from the industry standard is measured in millimeters. The results are presented here. Process A Process B Sample mean 2.0 3.0 Standard deviation 1.0 0.5 Sample size 12 14 The researcher is interested in determining whether there is evidence that the two processes yield different average errors. The population standard deviations are unknown but assumed equal. What is the alternate hypothesis? A: H1: µA ≠ µB Product FIFO (F) LIFO (L) This example is what type of test? A: a two sample test of means A national manufacturer of ball bearings is experimenting with two different processes for producing precision ball bearings. It is important that the diameters be as close as possible to an industry standard. The output from each process is sampled and the average error from the industry standard is measured in millimeters. The results are presented here. Process A Process B Sample mean 2.0 3.0 Standard deviation 1.0 0.5 Sample size 12 14 The researcher is interested in determining whether there is evidence that the two processes yield different average errors. The population standard deviations are unknown but assumed equal. What is the critical t-value at the 1% level of significance? A: +2.797 The results of a mathematics placement exam at two different campuses of Mercy College follow: Campus Sample Size Sample Mean Population Standard Deviation 1 330 33 8 2 310 31 7 What is the null hypothesis if we want to test the hypothesis that the mean score on Campus 1 is higher than on Campus 2? A: H0: µ1 ≤ µ2 Assuming the population variances are known, the population variance of the difference between two means is _______. A: the sum of two population variances A recent study focused on the amount of money single men and women save monthly. The information is summarized here. Assume that the population standard deviations are equal. Sample Size Sample Mean Population Standard Deviation Men 25 23 5 Women 30 28 10 At the 0.01 significance level, do women save more money than men? What is the value of the test statistic for this hypothesis test? A: +2.40 national manufacturer of ball bearings is experimenting with two different processes for producing precision ball bearings. It is important that the diameters be as close as possible to an industry standard. The output from each process is sampled, and the average error from the industry standard is measured in millimeters. The results are presented here. Process A Process B Sample mean 2.0 3.0 Standard deviation 1.0 0.5 Sample size 12 14 The researcher is interested in determining whether there is evidence that the two processes yield different average errors. The population standard deviations are unknown but are assumed equal. What is the null hypothesis? A: H0: µA = µB he results of a mathematics placement exam at two different campuses of Mercy College follow: Campus Sample Size Sample Mean Population Standard Deviation 1 330 33 8 2 310 31 7 What is the alternative hypothesis if we want to test the hypothesis that the mean score on Campus 1 is higher than on Campus 2? A: H1: µ1 ≤ µ2 Chapter 11 Pt 2 A recent study focused on the amount of money single men and women save monthly. The information is summarized here. Assume that the population standard deviations are equal. Sample Size Sample Mean Population Standard Deviation Men 25 23 5 Women 30 28 10 At the 0.01 significance level, do women save more money than men? What is the value of the test statistic for this hypothesis test? A: +2.40 Which condition must be met to conduct a test for the difference in two sample means using a z-statistic? A: The two population standard deviations must be known. When testing the difference between two dependent population means, the test statistic is based on A: standard deviation of the differences When testing the difference between two population means, the sample variances are pooled to estimate the population variance when _______. A: the population variances are assumed equal but unknown Assuming the population variances are known, the population variance of the difference between two means is _______. A: The sum of two population variances When is it appropriate to use the paired difference t-test? A: When two dependent samples are compared Twenty randomly selected statistics students were given 15 multiple choice questions and 15 open-ended questions, all on the same material. The professor was interested in determining if students scored higher on the multiple choice questions. This experiment is an example of ____. A: a two-sample test of means The results of a mathematics placement exam at two different campuses of Mercy College follow: Campus Sample Size Sample Mean Population Standard Deviation Given that the two population standard deviations are known, what is the p-value? A: 0.0 An investigation of the effectiveness of a training program to improve customer relationships included a pre-training and a post-training customer survey. To compare the differences they computed post-training survey score − pre-training survey score. Seven customers were randomly selected and completed both surveys. The results are shown here. Customer Pre-training Survey Post-training Survey For a 0.05 significance level, what is the critical value? A: 1.943 A national manufacturer of ball bearings is experimenting with two different processes for producing precision ball bearings. It is important that the diameters be as close as possible to an industry standard. The output from each process is sampled and the average error from the industry standard is measured in millimeters. The results are presented here. Process A Process B Sample mean 2.0 3.0 Standard deviation 1.0 0.5 Sample size 12 14 The researcher is interested in determining whether there is evidence that the two processes yield different average errors. The population standard deviations are unknown but assumed equal. What is the critical t-value at the 1% level of significance? A: +- 2.797 A recent study focused on the number of times men and women send a Twitter message in a day. The information is summarized here. Sample Size Sample Mean Population Standard Deviation Men 25 23 5 Women 30 28 10 At the 0.01 significance level, we ask if there is a difference in the mean number of times men and women send a Twitter message in a day. What is the p-value for this hypothesis test? A: 0.0164 A national manufacturer of ball bearings is experimenting with two different processes for producing precision ball bearings. It is important that the diameters be as close as possible to an industry standard. The output from each process is sampled, and the average error from the industry standard is measured in millimeters. The results are presented here. Process A Process B The researcher is interested in determining whether there is evidence that the two processes yield different average errors. The population standard deviations are unknown but assumed equal. What is the alternate hypothesis? A: A national manufacturer of ball bearings is experimenting with two different processes for producing precision ball bearings. It is important that the diameters be as close as possible to an industry standard. The output from each process is sampled, and the average error from the industry standard is measured in millimeters. The results are presented here. Process A Process B Sample mean 2.0 3.0 Standard deviation 1.0 0.5 Sample size 12 14 The researcher is interested in determining whether there is evidence that the two processes yield different average errors. The population standard deviations are unknown but are assumed equal. What is the null hypothesis? A: A recent study focused on the number of times men and women send a Twitter message in a day. The information is summarized here. Sample Size Sample Mean Population Standard Deviation Men 25 23 5 Women 30 28 10 At the 0.01 significance level, is there a difference in the mean number of times men and women send a Twitter message in a day? Based on the p-value, what is your conclusion? A: Reject the null hypothesis and conclude the means are different. A national manufacturer of ball bearings is experimenting with two different processes for producing precision ball bearings. It is important that the diameters be as close as possible to an industry standard. The output from each process is sampled and the average error from the industry standard is measured in millimeters. The results are presented here. The researcher is interested in determining whether there is evidence that the two processes yield different average errors. The population standard deviations are unknown but assumed equal. What is the critical t-value at the 1% level of significance? A: +- 2.797 An investigation of the effectiveness of a training program to improve customer relationships included a pre-training and a post-training customer survey. To compare the differences they computed post-training survey score − pre-training survey score. Seven customers were randomly selected and completed both surveys. The results are shown here. Customer Pre-training Survey Post-training Survey What is the value of the test statistic? A: 1.895 A company is researching the effectiveness of a new website design to decrease the time to access a website. Five website users were randomly selected, and their times (in seconds) to access the website with the old and new designs were recorded. To compare the times, they computed new website design time − old website design time. The results are shown here. User Old Website Design New Website Design What is the value of the test statistic? A: 2.256 Accounting procedures allow a business to evaluate its inventory costs based on two methods: LIFO (last in first out) or FIFO (first in first out). A manufacturer evaluated its finished goods inventory (in $000s) for five products with the LIFO and FIFO methods. To analyze the difference, they computed FIFO − LIFO for each product. Based on the following results, does the LIFO method result in a lower cost of inventory than the FIFO method? This example is what type of test? A: a paired t-test Accounting procedures allow a business to evaluate its inventory costs based on two methods: LIFO (last in first out) or FIFO (first in first out). A manufacturer evaluated its finished goods inventory (in $000s) for five products with the LIFO and FIFO methods. To analyze the difference, they computed FIFO − LIFO for each product. We would like to determine if the LIFO method results in a lower cost of inventory than the FIFO method. What is the value of calculated t? A: (1.93) closet was +0.933 A company is researching the effectiveness of a new website design to decrease the time to access a website. Five website users were randomly selected, and their times (in seconds) to access the website with the old and new designs were recorded. To compare the times, they computed new website design time − old website design time. The results follow. User Old Website Design New Website Design For a 0.01 significance level, what is the critical value? A: (3.747) closest was -3.747 The results of a mathematics placement exam at two different campuses of Mercy College follow: Campus Sample Size Sample Mean Population Standard Deviation Given that the two population standard deviations are known, what is the p-value? A: 0.0 The results of a mathematics placement exam at two different campuses of Mercy College follow: Campus Sample Size Sample Mean Population Standard Deviation What is the alternative hypothesis if we want to test the hypothesis that the mean score on Campus 1 is higher than on Campus 2? A: **** The results of a mathematics placement exam at two different campuses of Mercy College follow: Campus Sample Size Sample Mean Population Standard Deviation What is the null hypothesis if we want to test the hypothesis that the mean score on Campus 1 is higher than on Campus 2? A: A company is researching the effectiveness of a new website design to decrease the time to access a website. Five website users were randomly selected, and their times (in seconds) to access the website with the old and new designs were recorded. To compare the times, they computed new website design time − old website design time. The results follow. User Old Website Design New Website Design What is the alternative hypothesis? A: A national manufacturer of ball bearings is experimenting with two different processes for producing precision ball bearings. It is important that the diameters be as close as possible to an industry standard. The output from each process is sampled, and the average error from the industry standard is measured in millimeters. The results are presented here. Process A Process B Sample mean 2.0 3.0 Standard deviation 1.0 0.5 Sample size 12 14 The researcher is interested in determining whether there is evidence that the two processes yield different average errors. The population standard deviations are unknown but are assumed equal. What are the degrees of freedom? A: 24 A recent study focused on the amount of money single men and women save monthly. The information is summarized here. Assume that the population standard deviations are equal. Sample Size Sample Mean Population Standard Deviation Men 25 23 5 Women 30 28 10 At the 0.01 significance level, do women save more money than men? What is the value of the test statistic for this hypothesis test? A: +2.40 Use the following table to determine whether or not there is a significant difference between the average hourly wages at two manufacturing companies. Manufacture 1 Manufacturer 2 n1 = 81 n2 = 64 x1=$15.80x1=$15.80 x2=$15.00x2=$15.00 σ1 = $3.00 σ2 = $2.25 What is the test statistic for the difference between the means? A: 1.83 Chapter 13 Quiz In regression, if the relationship between the dependent and independent variables is nonlinear, a linear relationship between the variables can be achieved by ______. A: rescaling the variables In regression analysis, what is the predictor variable called? A: dependent variable What is the range of values for the coefficient of determination? A: 0% to 100% inclusive In the regression equation, what does the letter "a" represent? A: the Y-intercept If all the plots on a scatter diagram lie on a straight line, what is the standard error of estimate? A: 0 Which value of r indicates a stronger correlation than 0.40? A: -0.80 If r = 0.65, what does the coefficient of determination equal? A: 0.4225=0.423 If the correlation between two variables is close to one, the association between the variables is_____. A: Strong What does a coefficient of correlation of 0.70 infer? A: The coefficient of determination is 0.49. if the correlation coefficient has a negative value, then the coefficient of determination. A: can take on either a negative or positive value. In regression, the difference between the confidence interval and prediction interval formulas is____. A: the addition of 1 to the quantity under the radical sign if the coefficient of determination is 0.94, what can we say about the relationship between two variables? A: 94% of the total variation of the dependent variable is explained by the independent variable. What is the chart called when the paired data (the dependent and independent variables) are plotted? A: a scatter diagram A sales manager for an advertising agency believes that there is a relationship between the number of contacts that a salesperson makes and the amount of sales dollars earned. What is the dependent variable? A: amount of sales dollars What does the coefficient of determination equal if r = 0.89? A: 0.7921 Which of the following is true about the standard error of estimate? A: It is a measure of the accuracy of the prediction. Which of the following is the same between a confidence interval and a prediction interval? A: (THEY BOTH USE THE STD ERROR OF ESTIMATE) A sales manager for an advertising agency believes that there is a relationship between the number of contacts that a salesperson makes and the amount of sales dollars earned. A regression analysis shows the following results: What is the Y-intercept of the linear equation? A: -12.201 The regression equation is Ŷ = 29.29 − 0.96X, the sample size is 8, and the standard error of the slope is 0.22. What is the critical value to test the significance of the slope at the 0.01 significance level? A: t=+ or – 3.707 The regression equation is Ŷ = 30 + 2.56X, the sample size is 14, and the standard error of the slope is 0.97. What is the test statistic to test the significance of the slope? A: t=+ 2.639 Consider the following regression analysis between sales (Y in $1,000) and social media advertising (X in dollars). Ŷ = 55,000 + 7X The regression equation implies that an _______. A: Increase of $7 advertising is associated with an increase of $7000 in sales A sales manager for an advertising agency believes there is a relationship between the number of contacts that a salesperson makes and the amount of sales dollars earned. A regression analysis shows the following results: Coefficients Standard Error t-Stat p-value Intercept -12.201 6.560 -1.860 0.100 Number of contacts 2.195 0.176 12.505 0.000 What is the slope of the linear equation? A: 2.195 Coefficients Intercept -12.8094 Independent variable 2.1794 ANOVA df SS MS F Regression 1 12323.56 12323.56 90.0481 Residual 8 1094.842 136.8550 Total 9 13418.4 The regression equation is _______. A: Ŷ = − 12.8094+ 2.1794X The regression equation is Ŷ = 30 + 2.56X, the sample size is 14, and the standard error of the slope is 0.97. What is the critical value to test the significance of the slope at the 0.05 significance level? A: t= + or – 2.179 A sales manager for an advertising agency believes there is a relationship between the number of contacts that a salesperson makes and the amount of sales dollars earned. A regression analysis shows the following results: Coefficients Standard Error t Stat p value Intercept -12.201 6.560 -1.860 0.100 Number of contacts 2.195 0.176 12.505 0.000 What is the decision regarding the hypothesis if the p value for the slope equals zero? A: Reject the null hypothesis QNTP 5000 Final Exam Why are unequal class intervals sometimes used in a frequency distribution? A: to avoid a large number of classes with very small frequencies A group of 100 students was surveyed about their interest in a new International Studies program. Interest was measured in terms of high, medium, or low. In the study, 30 students responded high interest, 40 students responded medium interest, and 30 students responded low interest. What is the relative frequency of students with high interest? A: 0.30 Sometimes, a data set has two values that have the highest and equal frequencies. In this case, the distribution of the data can best be described as A: Bimodal (having two modes) A sample of experienced typists revealed that their mean typing speed is 87 words per minute and the median typing speed is 73 words per minute. The standard deviation of typing speed is 16.9 words per minute. What is the Pearson coefficient of skewness? A: +2.5 What does the complement rule state? A: P(A)=1-P(not A) The time to fly between New York City and Chicago is uniformly distributed with a minimum of 120 minutes and a maximum of 150 minutes. What is the probability that a flight is less than 135 minutes? A: 0.50 An experiment involves selecting a random sample of 256 middle managers for study. One item of interest is their annual income. The sample mean is computed to be $35,420. If the population standard deviation is $2,050, what is the standard error of the mean? A: $128.125 A sampling distribution of the means is a probability distribution consisting of all possible sample means of a given sample size selected from a population. A: TRUE A sample of 500 students is selected from a known population of 15,000 students to construct a 99% confidence interval for the average SAT score. What correction factor should be used to compute the standard error? A: 0.9832 A hypothesis regarding the weight of newborn infants at a community hospital is that the mean is 6.6 pounds. A sample of seven infants is randomly selected and their weights at birth are recorded as 9.0, 7.3, 6.0, 8.8, 6.8, 8.4, and 6.6 pounds. What are the degrees of freedom? A: 6 The average cost of tuition and room and board for a small private liberal arts college is reported to be $8,500 per term, but a financial administrator believes that the average cost is higher. A study conducted using 350 small liberal arts colleges showed that the average cost per term is $8,745. The population standard deviation is $1,200. Let α = 0.05. What are the null and alternative hypotheses for this study? A: H0: µ ≤ $8,500; H1: µ > $8,500 The Greek letter used to represent the probability of a Type I error is alpha (α). A: TRUE Which of the following is not one of the six steps in the hypothesis testing procedure? A: Select a level for (B-symbol for Beta) What does the coefficient of determination equal if r = 0.89? A: 0.7921 The length of a bridge, measured in meters, is an example of ____. A: quantitative data The reported unemployment is 5.5% of the population. What measurement scale is used to measure unemployment? A: Ratio ( or Interval) What is the relationship between the variance and the standard deviation? A: Variance is the square root of the standard deviation Each salesperson in a large department store chain is rated on his or her sales ability and potential for advancement. The data for the 500 sampled salespeople are summarized in the following table. Potential for Advancement Fair Good Excellent What is the probability that a salesperson selected at random will have below-average sales ability and fair potential for advancement? A: 0.032 A coin is tossed three times. The following table summarizes the experiment. What is the following table called? Number of Heads Probability of the Outcome 0 A: Probability Distribution For the following distribution: What is the mean of the distribution? A: 0.113 Using the following information: Coefficients Intercept -12.8094 Independent variable 2.1794 ANOVA df SS MS F What is the standard error of the estimate? A: 11.6985????? A sales manager for an advertising agency believes there is a relationship between the number of contacts that a salesperson makes and the amount of sales dollars earned. A regression ANOVA shows the following results: ANOVA df SS MS F Significance F Regression 1.00 13555.42 13555.42 156.38 0.00 Residual 8.00 693.48 86.68 Total 9.00 14248.90 What is the value of the standard error of estimate? A: 9.310 The range of the coefficient of skewness is ____________. A: both positive and negative values [Show More]
Last updated: 2 years ago
Preview 1 out of 108 pages

Buy this document to get the full access instantly
Instant Download Access after purchase
Buy NowInstant download
We Accept:

Reviews( 0 )
$12.00
Can't find what you want? Try our AI powered Search
Document information
Connected school, study & course
About the document
Uploaded On
Feb 28, 2021
Number of pages
108
Written in

Additional information
This document has been written for:
Uploaded
Feb 28, 2021
Downloads
0
Views
227


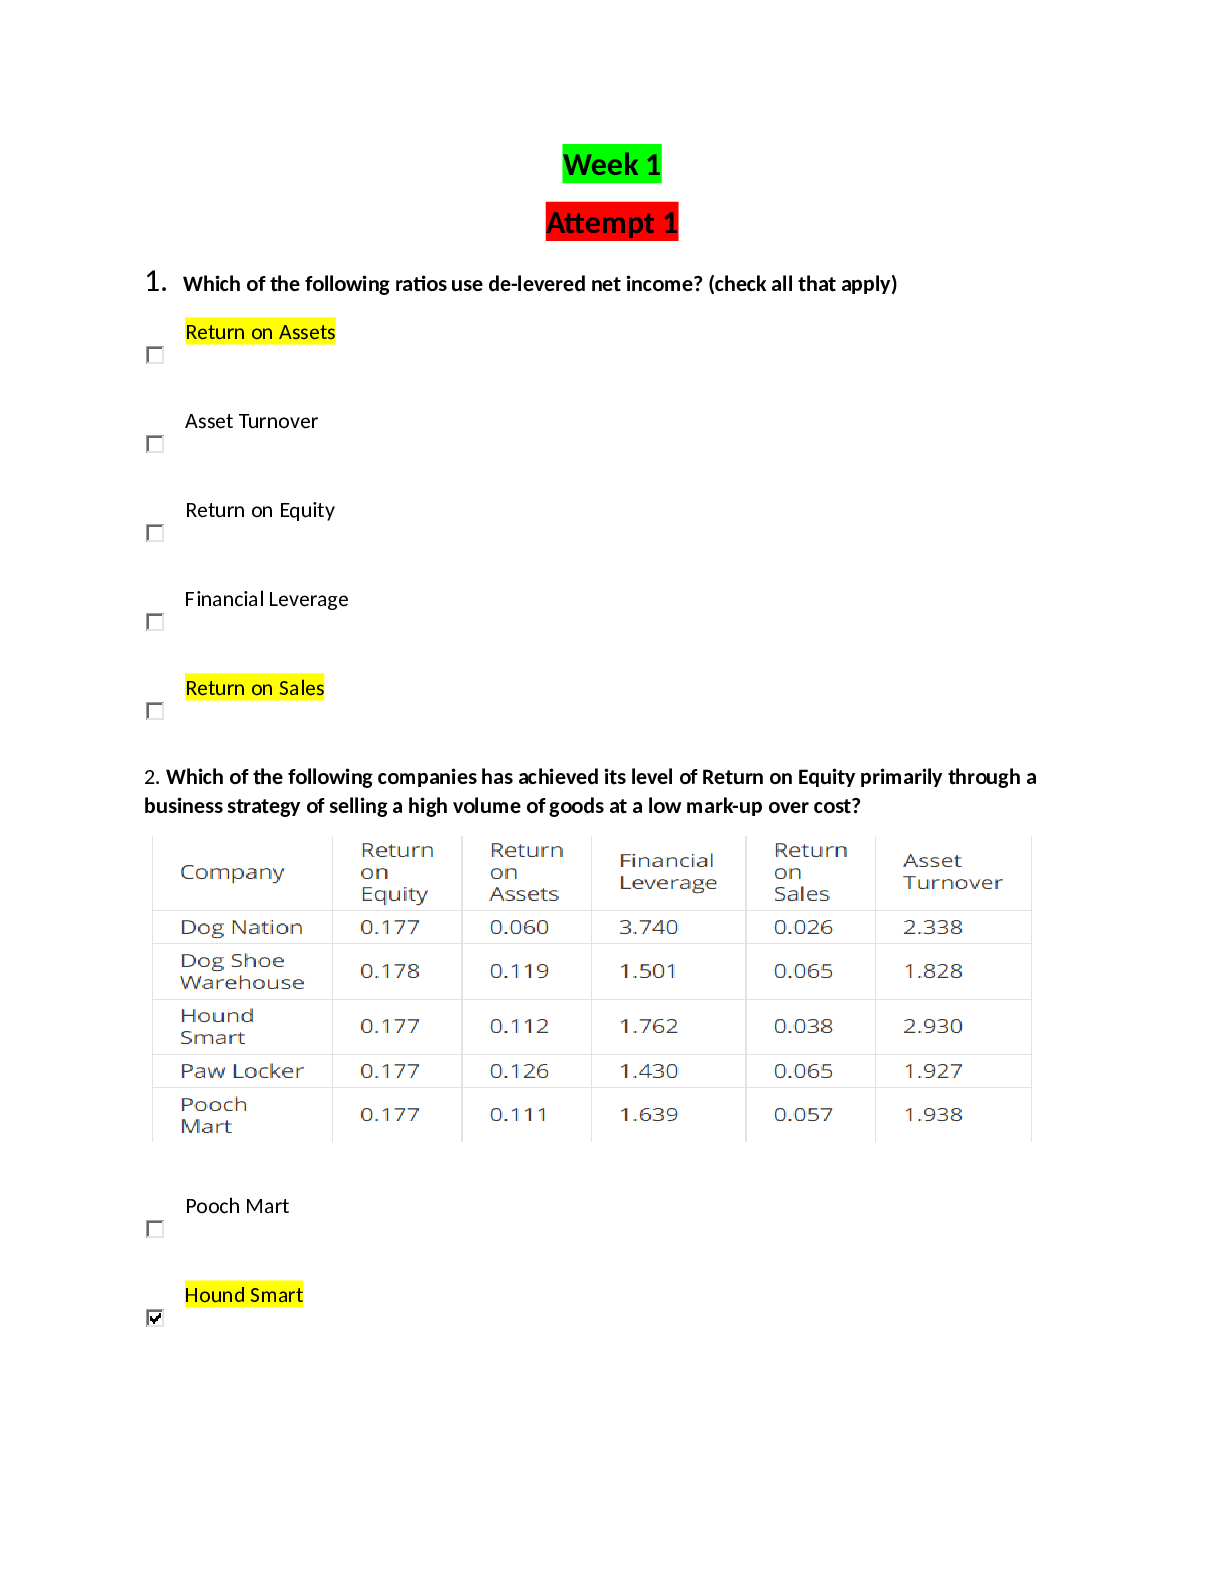
.png)
.png)
.png)
.png)
.png)
.png)
.png)
