Questions and Answers 100% correct solution.png)
ATI med surg retake (GRADED A) Questions and Answers 100% correct solution
Mathematics > DISCUSSION POST > MATH 225N Week 2 Discussion, Graphing and Describing Data in Everyday Life (All)
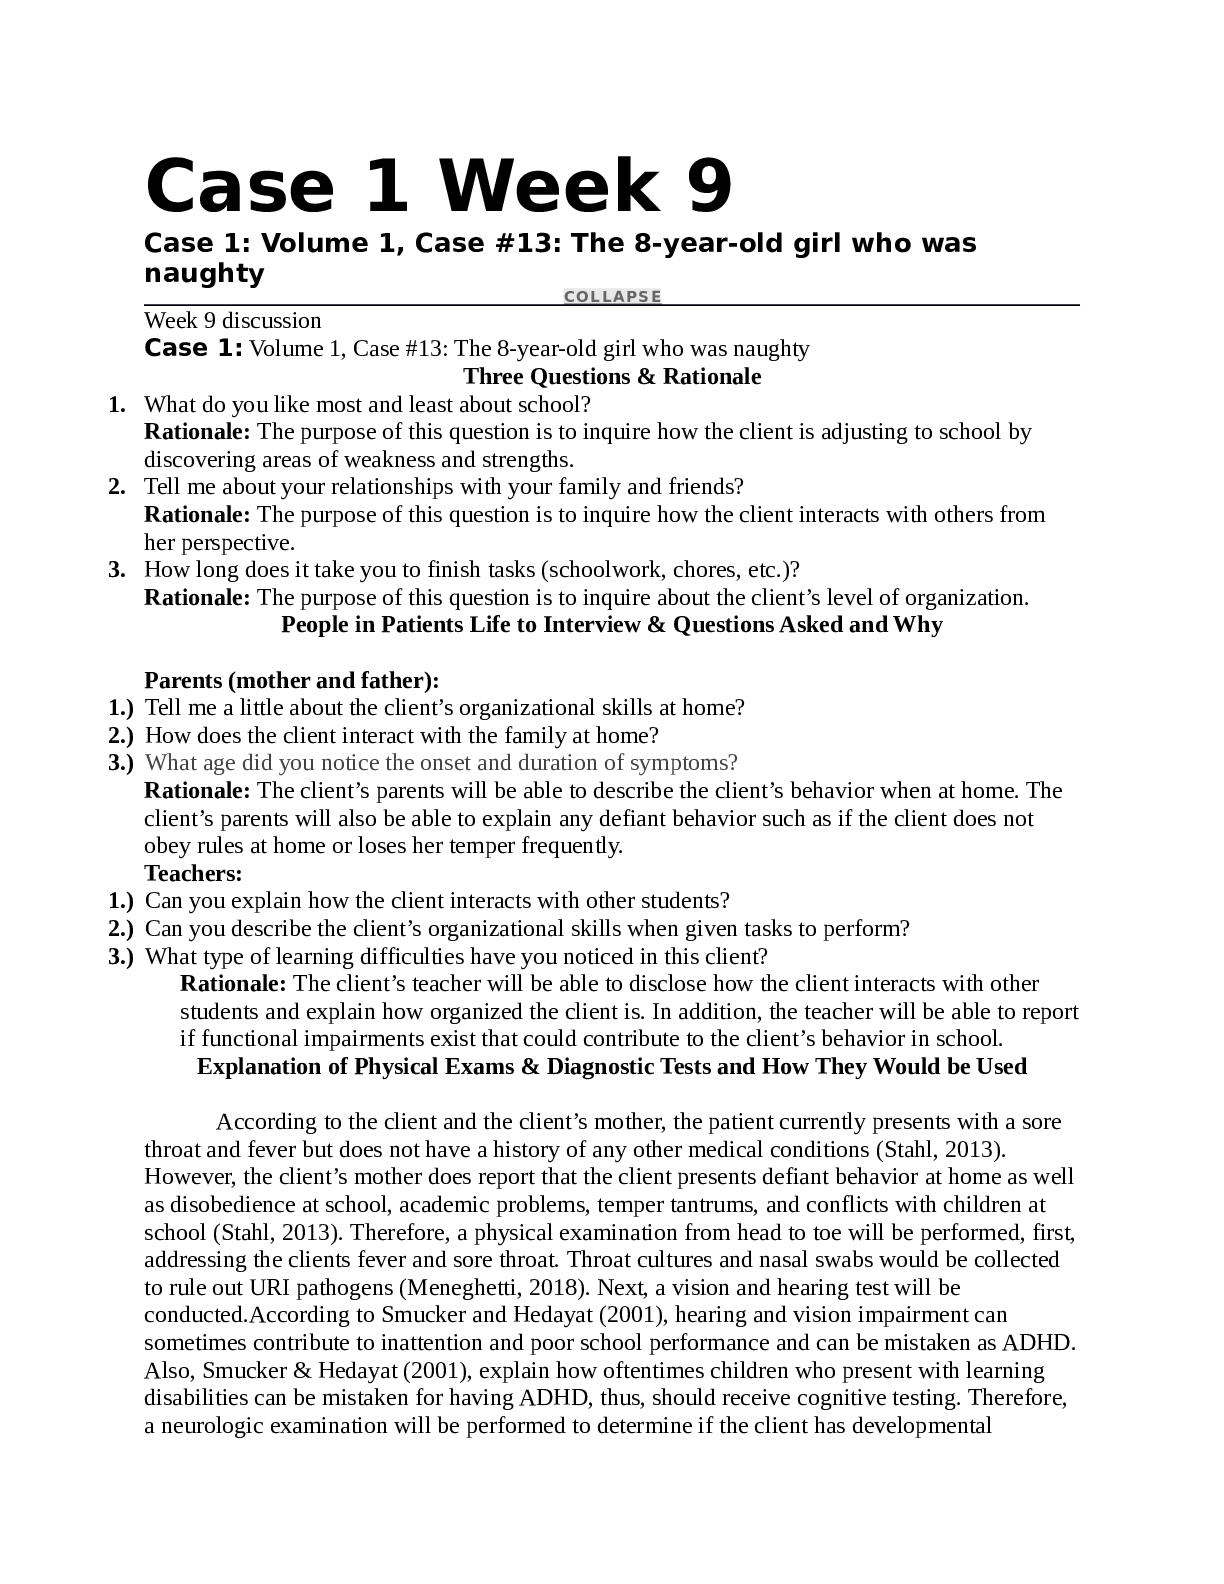
Graphing and Describing Data in Everyday Life Both sets of data are quantitative and should be organized in a manner that allows for the generation of relevant inferences. The first set of data comp ... rises of a list of all the injuries that were seen in a clinic in a month's time, and can be best represented using a cumulative frequency table. Data organized using a cumulative frequency table. Assuming that the hospital has been reporting an average number of injuries over the past year, the cumulative frequency would be very useful in determining the number of injuries that lie above or below the mean value. The second set contains data on the number of minutes that each patient spent in the waiting room of a doctor's office, and frequency table would be useful in this case because most patient wait times will be identical, and a frequency table would provide a good representation of the data as grouped data, especially along with their corresponding frequencies. A frequency table will provide an overview of all distinct values and the number of times they occur. Graphs provide an excellent opportunity for researchers to establish trends in the data collected (Nolan & Perrett, 2016). To graph the first set of data, a line graph would be very useful in representing the set of data values in a manner that demonstrates variation in the frequency of the injuries with time. This means that the x-axis would have the time and the y-axis would have the number of injuries, thus, providing a general pattern in the data sets as noted by Holmes, Illowsky, and Dean (2018). The second set of data can be best represented using a histogram graph because is considered the best with continuous quantitative data (Holmes et al., 2018). The data (wait times) will be put into classes or bins with regular intervals and frequency counts. The frequency for each bin would be graphed on the y-axis while the bins would be on the x-axis. This study source was downloaded by 100000831988016 from CourseHero.com on 04-29-2022 12:08:52 GMT -05:00 https://www.coursehero.com/file/45661496/MATH-225N-Week-2-Discussion-Graphing-and-Describing-Data-in-Everyday-Lifedocx/ References Holmes, A., Illowsky, B. & Dean, S. (2018). Introductory business statistics. Houston, Texas: OpenStax. Nolan, D., & Perrett, J. (2016). Teaching and learning data visualization: Ideas and assignments. The American Statistician, 70(3), 260-269 [Show More]
Last updated: 3 years ago
Preview 1 out of 2 pages

Buy this document to get the full access instantly
Instant Download Access after purchase
Buy NowInstant download
We Accept:

MATH 225N Week 1 Assignment Comparing Sampling Methods Q & A MATH 225N Week 1 Evidence, Claims, and types Questions and Answers MATH 225N Week 1 Assignment Sampling Methods – Questions and Answers MAT...
By Nutmegs 3 years ago
$30
7
Can't find what you want? Try our AI powered Search
Connected school, study & course
About the document
Uploaded On
Apr 29, 2022
Number of pages
2
Written in
All
This document has been written for:
Uploaded
Apr 29, 2022
Downloads
0
Views
173
Scholarfriends.com Online Platform by Browsegrades Inc. 651N South Broad St, Middletown DE. United States.
We're available through e-mail, Twitter, Facebook, and live chat.
FAQ
Questions? Leave a message!
Copyright © Scholarfriends · High quality services·


.png)