64 Chapter 3
Chapter 3
Supply and Demand: Theory
1. The law of demand states that price and quantity demanded are
a. directly related, ceteris paribus.
b. inversely related, ceteris paribus.
c. independent.
d. pos
...
64 Chapter 3
Chapter 3
Supply and Demand: Theory
1. The law of demand states that price and quantity demanded are
a. directly related, ceteris paribus.
b. inversely related, ceteris paribus.
c. independent.
d. positively related, ceteris paribus.
2. Which of the following illustrates the law of demand?
a. Jeff buys more pens at $1 per pen than at $2 per pen, ceteris paribus.
b. Sara buys more ice cream at $2 per half-gallon than at $1 per half gallon, ceteris paribus.
c. Chris buys fewer trousers at $30 per pair than at $25 per pair, ceteris paribus.
d. a, b, and c
e. a and c
3. At a price of $15, Marta buys 3 CD’s per month. When the price increases to $20, Marta buys 2
CD’s per month. Leah says that Marta’s demand for CD’s has decreased. Is Leah correct?
a. Yes, Leah is correct.
b. No, Leah is incorrect. Marta’s demand has increased.
c. No, Leah is incorrect. Marta’s quantity demanded has decreased, but her demand has stayed
the same.
d. No, Leah is incorrect. Marta’s quantity demanded has increased, but her demand has stayed the
same.
e. No, Leah is incorrect. Marta’s quantity demanded has decreased and her demand has increased.
4. A major reason for the law of demand is that
a. one price changing requires at least one other price to change in the opposite direction.
b. people substitute lower-priced goods for higher-priced goods.
c. a higher price never reduces quantity demanded by enough to lower total revenue.
d. people are willing to produce more units at a higher price.
5. The price of pizzas rises, and Mei increases her monthly purchases of pizza. Therefore, the law of
demand
a. doesn’t hold for any good.
b. doesn’t hold during a month.
c. doesn’t hold for pizzas.
d. doesn’t hold for Mei.
e. none of the above
6. A demand schedule is a listing of
65 Chapter 3
a. incomes and quantities demanded.
b. costs and quantities demanded.
c. prices and quantities demanded.
d. assets and quantities demanded.
7. If an increase in income results in an increase in the demand for chicken, then
chicken is
a. a neutral good.
b. a luxury good.
c. a normal good.
d. an inferior good.
8. If Max’s demand for hot dogs falls as his income rises, then hot dogs are
a. a bad good.
b. an inferior good.
c. a preferential good.
d. a normal good.
e. a neutral good.
9. A decrease in the number of buyers in an area will result in a
a. movement up the demand curve.
b. movement down the demand curve.
c. leftward shift in the demand curve.
d. rightward shift in the demand curve.
10. If the demand curve for a good shifts leftward,
a. quantity demanded is less at each price.
b. quantity demanded remains constant at each price.
c. quantity demanded is greater at each price.
d. demand is greater at each price.
11. If people begin to favor romance novels to a greater degree than previously, the demand curve for
romance novels
a. shifts rightward.
b. shifts leftward.
c. stays constant.
d. can shift either rightward or leftward.
12. As the price of good X rises, the demand for good Y falls. Therefore, goods X and Y are
Supply and Demand: Theory 66
a. substitutes.
b. normal goods.
c. complements.
d. inferior goods.
e. none of the above
13. As the price of good A rises, the demand for good B rises. Therefore, goods A and B are
a. normal goods.
b. inferior goods.
c. substitutes.
d. complements.
e. none of the above
14. If good A is a normal good, an increase in income will
a. shift the demand curve for good A leftward.
b. shift the demand curve for good A rightward.
c. not affect the demand for good A.
d. result in a surplus of good A.
15. “As the price of apples goes up, the demand for apples goes down.” The author of this statement
a. implies that price and demand are unrelated.
b. uses the word “demand” when he should use the word “supply.”
c. uses the word “demand” when he should use the words “quantity demanded.”
d. implies that demand and price have a direct relationship.
16. The law of supply states that price and quantity supplied are
a. inversely related, ceteris paribus.
b. directly related, ceteris paribus.
c. not related.
d. fixed.
17. Which of the following is true about the relationship between price and quantity supplied?
a. There is always a direct relationship.
b. There is always an inverse relationship.
c. There is usually a direct relationship.
d. There is usually an inverse relationship.
18. Resource X is necessary to the production of good Y. If the price of resource X rises,
a. the supply curve of Y shifts leftward.
b. the supply curve of Y shifts rightward.
c. the supply curve of Y is unaffected.
d. there is a movement down the supply curve of Y.
e. there is a movement up the supply curve of Y.
67 Chapter 3
19. If the workers of a firm successfully negotiate an increase in wages,
a. the demand curve for the product the firm produces shifts rightward.
b. the demand curve for the product the firm produces shifts leftward.
c. the supply curve of the product the firm produces shifts rightward.
d. the supply curve of the product the firm produces shifts leftward.
e. none of the above
20. An advance in technology causes
a. a rightward shift in the supply curve.
b. a leftward shift in the supply curve.
c. the supply curve to go from upward sloping to vertical.
d. the supply curve to go from vertical to upward sloping.
21. The fundamental reason why most supply curves are upward sloping is that
a. people substitute lower-priced goods for higher-priced goods.
b. the quantity supplied increases as more firms enter the market.
c. a higher price never reduces quantity supplied by enough to lower total
revenue and so higher production is motivated.
d. higher production raises per-unit production cost and so must be
motivated by a higher one.
22. Tobacco production is one of the more heavily subsidized industries in the United States. Suppose
that as a result of intense lobbying from health-related concerns, Congress repeals the tobacco
firms’ subsidies. Which of the following scenarios would likely occur?
a. The tobacco firms’ supply curve would shift rightward, as it would now be cheaper to produce
each level of output.
b. The tobacco firms’ supply curve would shift leftward, since it would now cost more to produce
each level of output.
c. The tobacco firms would not experience any shift in their supply curves; subsidies don’t affect
output.
d. There would be a movement along the supply curve for tobacco, but the supply curve would not
shift.
23. Suppose the government decides that every family should own its own home. To bring this about,
the government decides to subsidize the home-construction industry by giving the homeconstruction companies $10,000 for every house that they build. As a result of this,
a. the supply curve of new houses would shift leftward, since it now costs $10,000 more for
builders to produce a house.
b. the demand curve for new houses would shift rightward, since now every family would want to
buy a house.
c. the demand curve for new houses would shift leftward.
d. the supply curve of new houses would shift rightward, since builders would be willing to
produce and sell more houses at each given price.
e. c and d
24. Oil producers expect that oil prices next year will be lower than oil prices this year. As a result, oil
Supply and Demand: Theory 68
producers are most likely to
a. place more oil on the market this year, thus shifting the present supply curve of oil rightward.
b. hold some oil off the market this year, thus shifting the present supply curve of oil leftward.
c. place more oil on the market this year, thus increasing the quantity supplied of oil at lower but
not higher prices.
d. hold some oil off the market this year, thus decreasing the quantity supplied of oil at lower but
not higher prices.
25. Which of the following will not shift a supply curve?
a. a change in the price of relevant resources
b. a change in the good’s price
c. a change in the number of sellers
d. a change in per-unit costs brought about by a change in taxes.
26. At a price above equilibrium price, there is
a. a shortage.
b. a surplus.
c. excess demand.
d. super-equilibrium.
e. none of the above
27. At a price below equilibrium price, there is
a. a surplus.
b. a shortage.
c. excess supply.
d. sub-equilibrium.
e. none of the above
28. On a supply-and-demand diagram, equilibrium is found
a. where the supply curve intercepts the vertical axis.
b. where the demand curve intercepts the horizontal axis.
c. where the demand and supply curves intersect.
d. at every point on either curve
29. On a supply-and-demand diagram, quantity demanded equals quantity supplied
a. only at the single equilibrium price.
b. at every price at or above the equilibrium price.
c. at every price at or below the equilibrium price.
d. at every price.
30. At a price for which quantity demanded exceeds quantity supplied, a __________ is experienced,
69 Chapter 3
which pushes the price __________ toward its equilibrium value.
a. surplus; downward
b. surplus; upward
c. shortage; downward
d. shortage; upward
31. On a supply-and-demand diagram, consider a price for which the horizontal distance to the supply
curve exceeds the horizontal distance to the demand curve. There is a __________ at that price and
we are clearly __________ the equilibrium price.
a. shortage; above
b. shortage; below
c. surplus; above
d. surplus; below
32. On a supply-and-demand diagram, consider a price for which the horizontal distance to the supply
curve is less than the horizontal distance to the demand curve. There is a __________ at that price
and we are clearly __________ the equilibrium price.
a. shortage; above
b. shortage; below
c. surplus; above
d. surplus; below
33. If the supply curve and the demand curve for lettuce both shift to the left by an equal amount, what
can we say about the resulting changes in price and quantity?
a. The price will increase, but the quantity may increase or decrease.
b. The price will increase, and the quantity will increase.
c. The price will decrease, and the quantity will increase.
d. The price will stay the same, but the quantity will increase.
e. The price will stay the same, but the quantity will decrease.
34. If demand rises by a lesser amount than supply falls, then equilibrium price __________ and
equilibrium quantity __________.
a. rises; falls
b. falls; falls
c. rises; rises
d. falls; rises
35. If demand falls by a greater amount than supply falls, then equilibrium price __________ and
equilibrium quantity __________.
a. rises; rises
b. rises; falls
c. falls; rises
d. falls; falls
Supply and Demand: Theory 70
Exhibit C-1
6 4 2 0
150 250 350
Quantity
S1
D1
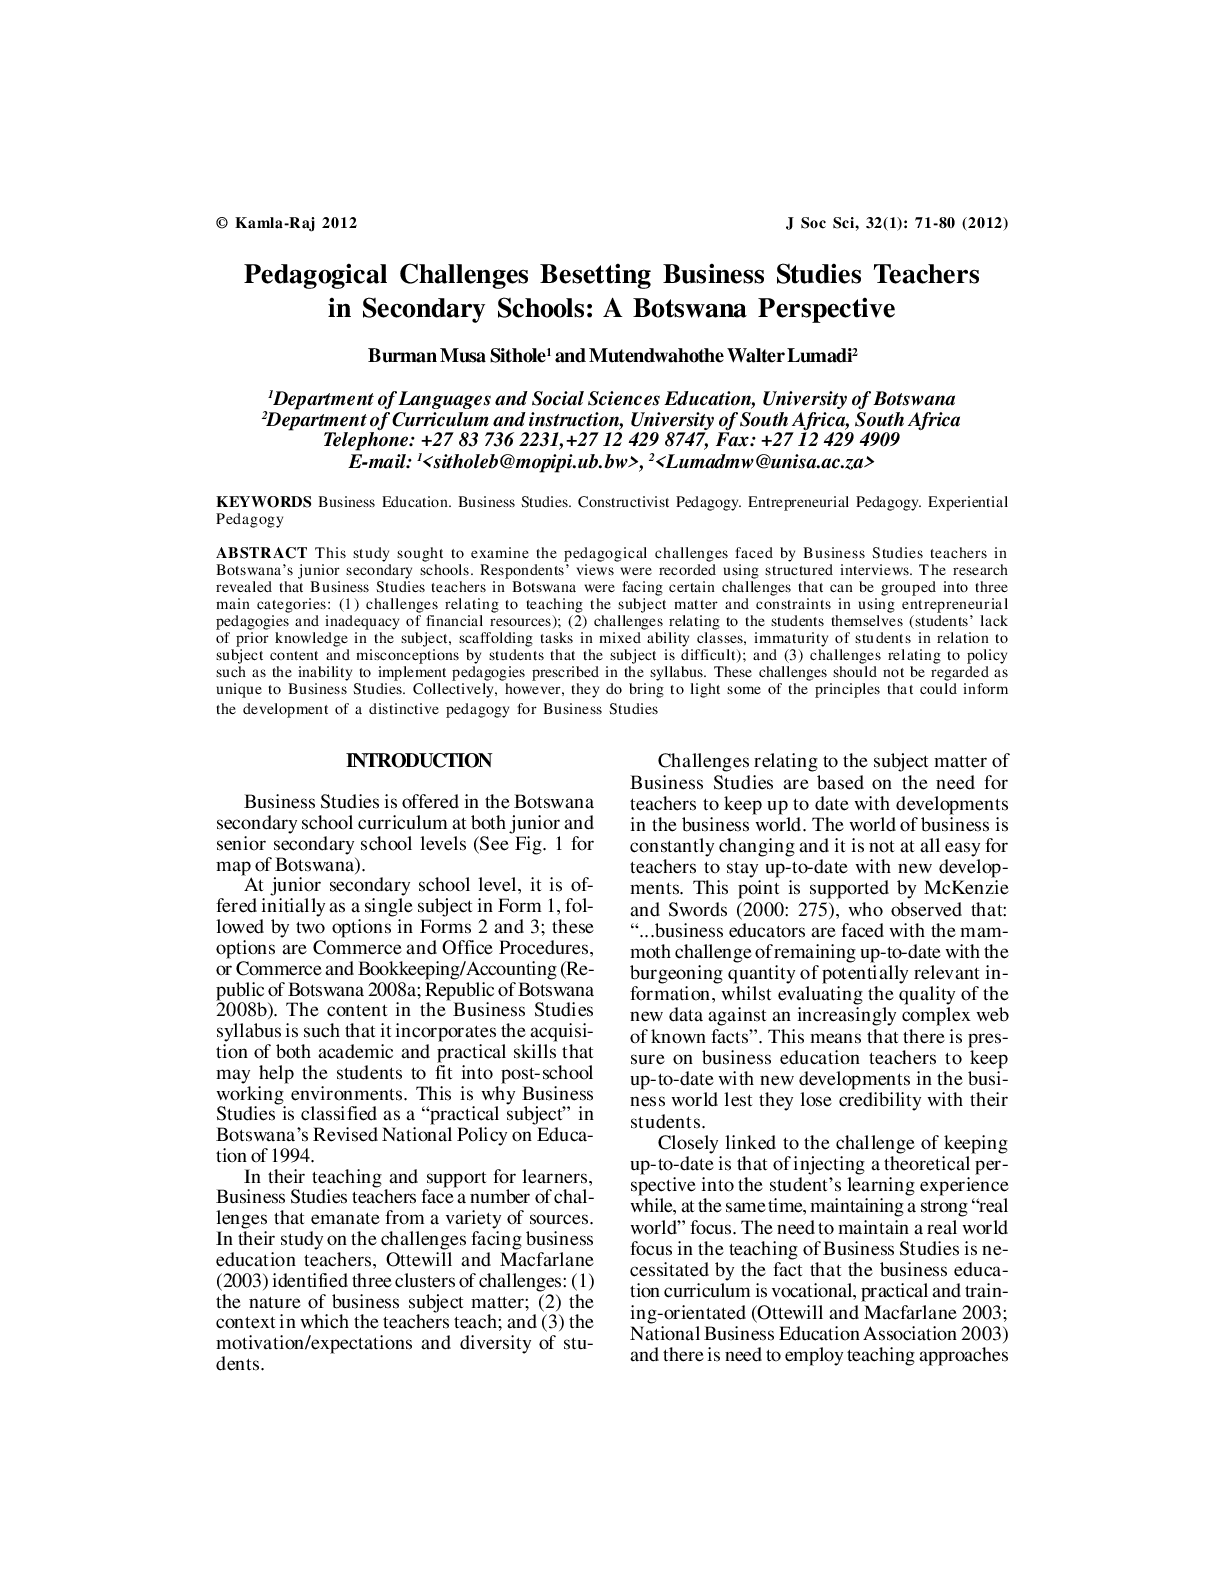
For questions 36-39, refer to Exhibit 3-1 above.
36. Refer to Exhibit 3-1. Equilibrium price and quantity are
a. $2 and 250 units.
b. $4 and 150 units.
c. $2 and 150 units.
d. $6 and 250 units.
e. none of the above
37. Refer to Exhibit 3-1. At $2 the shortage equals
a. 350 units.
b. 200 units.
c. 150 units.
d. There is no shortage at $2.
38. Refer to Exhibit 3-1. At $6 the surplus equals
a. 350 units.
b. 150 units.
c. 200 units.
d. There is no surplus at $6.
39. Refer to Exhibit 3-1. Which of the following statements is false?
a. Both demand and supply determine price.
b. 350 units of the good will be exchanged at equilibrium.
c. 250 units of the good will be exchanged at equilibrium.
d. The surplus at $6 is equal to the shortage at $2, that is, 200 units.
Exhibit 3-1
Price (dollars)
71 Chapter 3
Exhibit C-2
Quantity
Price
A
B
C
S1 S2
D1
D2
0
For questions 40-42, refer to Exhibit 3-2 above.
40. Refer to Exhibit 3-2. Which of the following would result in a movement from point A on D1 to
point B on D2?
a. a decrease in the price of a substitute
b. an increase in the price of a complement
c. a change in technology
d. an increase in the number of buyers
41. Refer to Exhibit 3-2. Suppose equilibrium is at point B. Something then changes and equilibrium
becomes point C. Which of the following is consistent with the change in equilibrium from point B
to C?
a. There was an increase in resource prices, and income stayed constant.
b. There was a decrease in resource prices, and income stayed constant.
c. There was an increase resource prices, and income decreased.
d. There was an increase in resource prices, and income increased.
42. Refer to Exhibit 3-2. Suppose equilibrium is at point A. Something then changes and equilibrium
becomes point C. Which of the following is consistent with the change in equilibrium from point A
to C?
a. There was an increase in income, and technology advanced.
b. There was a decrease in income, and technology advanced.
c. There was an increase in the price of a substitute and an increase in wages.
d. There was a decrease in the price of a complement and an increase in wages.
Exhibit 3-2
Supply and Demand: Theory 72
43. A rightward shift in the demand curve for tennis balls could be caused by
a. a fall in the price of tennis balls.
b. a fall in the price of tennis rackets.
c. a rise in the price of tennis lessons.
d. a fall in income, assuming tennis balls are a normal good.
44. An increase in the price of good B caused an increase in the demand for good C. This indicates that
a. B and C are complements.
b. B and C are substitutes.
c. B and C are neither substitutes nor complements.
d. B and C are normal goods.
Exhibit C-3
Quantity
Y
Z V
D1 D2
8 6 4 2 0
For questions 45-46, refer to Exhibit 3-3 above.
45. Refer to Exhibit 3-3. A movement from point Z to point Y would have been the result of
a. a price reduction.
b. an increase in population.
c. an improvement in technology.
d. an increase in the number of buyers.
46. Refer to Exhibit 3-3. A shift in demand from D1 to D2 can NOT occur from a change in
a. population.
b. price of a substitute.
c. income.
d. price.
Exhibit 3-3
Price (dollars)
73 Chapter 3
47. If the supply of and demand for a product both decrease, then equilibrium
a. quantity and equilibrium price must both decline.
b. quantity must decline, but equilibrium price may either rise, fall, or remain unchanged.
c. price must fall, but equilibrium quantity may either rise, fall, or remain unchanged.
d. quantity must fall and equilibrium price must rise.
Exhibit C-4
Quantity
S D
6 4 2
0 5 10 15 20
For questions 48-50, refer to Exhibit 3-4 above.
48. Refer to Exhibit 3-4. A price of $6 in the market will result in a
a. shortage of 10 units.
b. surplus of 10 units.
c. surplus of 5 units.
d. shortage of 5 units.
49. Refer to Exhibit 3-4. A price of $2 in the market will result in a
a. shortage of 10 units.
b. surplus of 10 units.
c. surplus of 5 units.
d. shortage of 5 units.
50. Refer to Exhibit 3-4. If this is a competitive market, price and quantity will gravitate toward
a. $6 and 10 units, respectively.
b. $6 and 20 units, respectively.
c. $4 and 15 units, respectively.
d. $2 and 15 units, respectively.
Exhibit 3-4
Price (dollars)
Supply and Demand: Theory 74
51. Given that frozen yogurt and ice cream are substitutes, a shift in preferences in favor of yogurt
would be predicted to do all of the following EXCEPT
a. raise the equilibrium price of yogurt.
b. increase the quantity supplied of yogurt.
c. increase the supply of ice cream.
d. increase the demand for yogurt.
52. An increase in the expected price of corn would likely
a. increase both the demand and supply of corn.
b. decrease both the demand and supply of corn.
c. increase the demand but decrease the supply of corn.
d. increase the supply but decrease the demand for corn.
53. In moving along a demand curve, which of the following is NOT held constant?
a. the prices of substitute goods
b. the prices of complementary goods
c. consumer incomes
d. the price of the good for which the demand curve is relevant
54. An “increase in the quantity demanded” means that
a. the demand curve has shifted to the right.
b. the supply curve has shifted to the left.
c. price has declined and consumers therefore want to purchase more of the good.
d. given supply, the price of the good can be expected to rise.
55. An “increase in demand” means that
a. the demand curve has shifted to the left.
b. price has declined and consumers want to purchase more of the good.
c. the demand curve has shifted to the right.
d. the price of the good can be expected to decline, assuming supply stays constant.
75 Chapter 3
Exhibit C-5
Quantity
S2
0
V
Y
W
X
S1
D1
D2
For questions 56-57, refer to Exhibit 3-5 above.
56. Refer to Exhibit 3-5. In the market shown,
a. point W shows the new equilibrium position.
b. the new equilibrium price and quantity are both greater than originally.
c. an increase in demand has been more than offset by an increase in supply.
d. the equilibrium position has shifted from W to V.
57. Refer to Exhibit 3-5. In the market shown, the rightward shift in supply may have been caused by
a. a decline in the number of buyers in the market.
b. a decline in the price of a substitute good.
c. a decrease in income (assuming the good is a normal good).
d. none of the above
58. Quantity demanded is the amount of a good that individuals __________ to buy at a particular price
during some time period.
a. are committed
b. need
c. are willing and able
d. all of the above
e. none of the above
Exhibit 3-5
Price (dollars)
Supply and Demand: Theory 76
Exhibit C-6
0 Quantity of Good X
C
D1
D2
A
B
D3
For questions 59-61, refer to Exhibit 3-6 above.
59. Refer to Exhibit 3-6. If an increase in income causes the demand for good X to shift from D1 to D3,
good X is
a. a normal good.
b. an inferior good.
c. a substitute good.
d. a complementary good.
e. a neutral good.
60. Refer to Exhibit 3-6. If an increase in the price of good Y causes the demand for good X to shift
from D1 to D2, goods X and Y are
a. normal goods.
b. inferior goods.
c. substitutes.
d. complements.
e. neutral goods.
61. Refer to Exhibit 3-6. If D1 is the relevant demand curve, a decrease in the price of good X may
cause
a. demand to shift from D1 to D2.
b. demand to shift from D1 to D3.
c. a movement along D1 from point A to point B.
d. a movement along D1 from point A to point C.
Exhibit 3-6
Price of Good X
77 Chapter 3
Exhibit C-7
0 Quantity of Good X
C
S1
S2
A
B
S3
For questions 62-63, refer to Exhibit 3-7 above.
62. Refer to Exhibit 3-7. If S1 is the relevant supply curve, a decrease in the price of a resource that is
necessary for the production of good X causes
a. the supply of good X to shift from S1 to S2
b. the supply of good X to shift from S1 to S3.
c. a movement along S1 from point A to point B.
d. a movement along S1 from point A to point C.
e. no change in the supply of good X.
63. Refer to Exhibit 3-7. If S1 is the relevant supply curve, an increase in the price of good X may cause
a. the supply of good X to shift from S1 to S2
b. the supply of good X to shift from S1 to S3.
c. a movement along S1 from point A to point B.
d. a movement along S1 from point A to point C.
e. no change in the quantity supplied of good X.
Exhibit 3-7
Price of Good X
Supply and Demand: Theory 78
Exhibit C-8
6 5 4 3 2 1 0
5 10 15 20 25 30
Quantity
S1
D1
For questions 64-65, refer to Exhibit 3-8 above.
64. Refer to Exhibit 3-8. Equilibrium price and quantity are
a. $3 and 25 units.
b. $3 and 15 units.
c. $5 and 15 units.
d. $5 and 25 units.
e. $1 and 25 units.
65. Refer to Exhibit 3-8. A shortage exists at any price below
a. $5.00.
b. $4.50.
c. $4.00.
d. $3.50.
e. $3.00.
Exhibit 3-8
Price (dollars)
79 Chapter 3
Exhibit C-9
Price
of X
S1
D1
Quantity Supplied of X
Price
of X
0 0 Quantity Demanded of X
A
B
S2
D2
E
F
For questions 66-70, refer to Exhibit 3-9 above.
66. Refer to Exhibit 3-9. A severe recession has sharply decreased the incomes of consumers. Knowing
that X is a normal good, you expect a movement in the market for X from
a. S2 to S1.
b. D1 to D2.
c. F to E.
d. B to A.
67. Refer to Exhibit 3-9. X is produced using input Z. If the price of Z rises, you expect a movement in
the market for X from
a. S1 to S2.
b. D2 to D1.
c. F to E.
d. B to A.
68. Refer to Exhibit 3-9. Consumers view X and Y as substitutes. If the price of Y increases, you expect
a movement in the market for X from
a. S1 to S2.
b. D1 to D2.
c. E to F.
d. B to A.
Exhibit 3-9
Supply and Demand: Theory 80
69. Refer to Exhibit 3-9. A wave of immigrants who love to consume X enters the country. You expect
a movement in the market for X from
a. S1 to S2.
b. D2 to D1.
c. A to B.
d. E to F.
70. Refer to Exhibit 3-9. The production of X is more profitable than it used to be. A number of
producers enter the business of producing X. You expect a movement in the market for X from
a. S2 to S1.
b. D2 to D1.
c. B to A.
d. S1 to S2.
71. The law of supply does not hold when
a. there is no time to produce more units of the good.
b. the good cannot be produced over any period of time.
c. government imposes price controls.
d. both a and b
e. none of the above
72. Equilibrium price and quantity are established by
a. demand only, if the economy is a market economy.
b. supply only, if the economy is a socialist economy.
c. both demand and supply.
d. supply only, if the economy is a capitalist economy.
73. A market is said to be in disequilibrium if
a. it exhibits either a surplus or a shortage.
b. the number of units that individuals are willing to buy exceeds the number of units they can
afford.
c. it is a market for an inferior good.
d. none of the above
81 Chapter 3
Exhibit C-10
30
20
10
0 100 200 300
S D
Quantity of X
For questions 74-77, refer to Exhibit 3-10 above.
74. Refer to Exhibit 3-10. If the price is $10,
a. sellers’ inventories rise
b. sellers will bid down the price.
c. buyers will bid up the price.
d. a and c
e. b and c
75. Refer to Exhibit 3-10. If the price is $30,
a. sellers’ inventories rise.
b. sellers will lower the price.
c. sellers will bid up the price.
d. a and b
e. b and c
76. Refer to Exhibit 3-10. $20 is the
a. equilibrium price.
b. market-clearing price.
c. price at which there is neither a surplus nor a shortage.
d. all of the above
Exhibit 3-10
Price of X (dollars)
Supply and Demand: Theory 82
77. Refer to Exhibit 3-10. 300 units of X will be exchanged in this market if the price is
a. $30.
b. $20.
c. $10.
d. any of the above
e. none of the above
78. A price ceiling is a government-mandated
a. minimum price below which legal trades cannot be made.
b. maximum price above which legal trades cannot be made.
C. minimum price above which legal trades cannot be made.
d. maximum price below which legal trades cannot be made.
79. Which of the following would not result from a price ceiling (below equilibrium price)?
a. a shortage
b. fewer exchanges
c. an increase in supply
d. nonprice rationing devices
80. Suppose the government imposes a price ceiling on a good above its equilibrium price. Which of
the following is a likely result?
a. Some other rationing device will emerge to allocate the good among buyers.
b. Some buyers and sellers will be willing to risk breaking the law in order to exchange the goods.
c. No change will occur in the market.
d. There may be buyers who are willing to pay quite high prices so they can consume more than
what they are consuming now.
e. a, b, and d
81. Suppose you live in New York City and the government has imposed rent ceilings on apartments.
You want to rent an apartment from Smith, who says that unless you buy the furniture in the
apartment for $4,000, he cannot rent the apartment to you. The condition of buying the furniture
could be considered
a. a price ceiling.
b. a price floor.
c. a tie-in sale.
d. something no renter would agree to.
e. c and d
82. Jake is an excellent barber. However, all customers who come to him for a haircut must buy a bottle
of shampoo. This type of arrangement is known as
a. a tie-in sale.
b. a sweetheart deal.
c. an exclusive contract.
d. a cross subsidy.
83 Chapter 3
Exhibit C-11
10
8 6
75 125 175
S D
Quantity
0
For questions 83-86, refer to Exhibit 3-11 above.
83. Refer to Exhibit 3-11. The number of units exchanged at the price ceiling is
a. 75.
b. 125.
c. 175.
d. 100 (175 - 75).
84. Refer to Exhibit 3-11. How many fewer units are exchanged because of the price ceiling than
ultimately would be exchanged in a free market?
a. 75
b. 60
c. 100
d. 65
e. none of the above
85. Refer to Exhibit 3-11. Suppose the good shown is being sold at the $6 price ceiling. At a quantity of
75 units, what is the maximum per-unit price buyers would be willing to pay for a good “tied” to
the good shown in the exhibit?
a. $10
b. $8
c. $6
d. $4
e. none of the above
Exhibit 3-11
Price Ceiling Price (dollars)
Supply and Demand: Theory 84
86. Refer to Exhibit 3-11. Some buyers will offer sellers $7 per unit instead of the $6 price ceiling
because
a. $7 is closer to the equilibrium price and buyers prefer equilibrium prices to all others.
b. they think it is only fair for sellers to receive higher prices.
c. they want to increase their chances of buying a good that is in shortage.
d. it is customary to pay more than the price ceiling.
87. Which of the following statements is true?
a. Price ceilings cause shortages.
b. Shortages cause price ceilings to be imposed.
c. Neither a price ceiling nor a shortage is the cause of the other.
d. Price ceilings cannot be imposed for longer than a month.
88. Buyers prefer lower prices to higher prices
a. always.
b. never.
c. rarely.
d. ceteris paribus.
89. A price floor is a government-mandated
a. minimum price below which legal trades cannot be made.
b. maximum price above which legal trades cannot be made.
c. minimum price at which all units of the good must be legally sold.
d. minimum price below which legal trades can be made.
90. One of the effects of a price floor (above equilibrium price) is
a. a surplus.
b. higher-quality goods are produced.
c. more satisfied customers.
d. all of the above
e. none of the above
85 Chapter 3
91. Suppose the government establishes a price floor on a good above its equilibrium price. It can be
said that at the price floor,
a. although sellers are selling all of the product that they desire at this price, the consumers are not
able to buy all that they desire.
b. although consumers are purchasing all of the product that they desire at this price, the sellers
are not selling all that they desire.
c. both sellers and buyers are satisfied with the quantity that is being exchanged.
d. both sellers and buyers are exchanging the equilibrium quantity of this good.
e. b and d
92. An economic concept that explains why Disneyland charges less for the second day of admission
than for the first day is
a. the law of supply.
b. the law of demand.
c. the law of diminishing marginal utility.
d. the law of diminishing returns.
e. none of the above
93. Which of the following pairs of goods would be most likely to be complements?
a. butter and margarine.
b. peanuts and peanut butter.
c. DVD’s and DVD players.
d. hiking boots and tennis shoes.
e. All of the above
94. Which of the following pairs of goods would be most likely to be substitutes?
a. pasta and pasta sauce
b. butter and margarine
c. chips and salsa
d. tires and automobiles
e. all of the above
95. An increase in the number of sellers will, ceteris paribus
a. increase equilibrium price and quantity.
b. increase equilibrium price and decrease equilibrium quantity.
c. decrease equilibrium price and increase equilibrium quantity.
d. decrease equilibrium price and quantity.
e. increase demand.
96. Tickets to the Super Bowl game are generally sold out well in advance of game day. This implies
that
a. the original ticket price is set above equilibrium.
b. the original ticket price is set below equilibrium.
c. there is a surplus of tickets at the original ticket price.
d. the law of demand does not apply to Super Bowl tickets
Supply and Demand: Theory 86
97. When firms advertise their product they are attempting to
a. shift the product’s supply curve to the right.
b. shift the product’s supply curve to the left.
c. shift the product’s demand curve to the right.
d. shift the product’s demand curve to the left.
Exhibit C-13
6 5 4 3 2 1 0
400 600 800 1,000
D
S
Quantity
For questions 98-99, refer to Exhibit 3-13 above.
98. Exhibit 3-13 represents the orange juice market. The horizontal line represents a price ceiling
imposed by the government. Which of the following is true?
a. At equilibrium, the quantity demanded is 700.
b. At the price ceiling, there is a surplus.
c. The quantity supplied at the price ceiling will equal the quantity sold.
d. The quantity demanded at the price ceiling will equal the quantity supplied.
e. The quantity demanded at the price ceiling will equal the quantity sold.
99. Exhibit 3-13 represents the orange juice market. The horizontal line at $2 shows a price ceiling
imposed by the government. Which of the following statements is true?
a. The surplus equals 400.
b. The shortage equals 400.
c. The surplus equals 300.
d. The shortage equals 200.
e. none of the above
Exhibit 3-13
Price (dollars)
87 Chapter 3
100. An effective price floor on rice will
a. force otherwise profitable farmers out of business.
b. result in a shortage of rice.
c. result in a surplus of rice.
d. clear the market for rice.
e. both a and b
101. A(n) _______________ good is one in which as income rises or falls, there is no change in the
demand for the good.
a. normal
b. inferior
c. neutral
d. substitute
e. complementary
102. An effective price ceiling will
a. clear the market.
b. result in a shortage.
c. result in a surplus.
d. induce new firms to enter the industry.
103. An effective price floor will
a. clear the market.
b. result in a shortage.
c. result in a surplus.
d. force some firms in this industry to go out of business.
104. Price ceilings and price floors
a. shift demand and supply curves and therefore have no effect upon the
rationing function of prices.
b. interfere with the rationing function of prices.
c. make the rationing function of free markets more efficient.
d. cause surpluses and shortages, respectively.
105. The rationing function of prices most nearly refers to the
a. ability of the price system to generate an equitable distribution of income.
b. capacity of a competitive market to equate the quantity demanded and the quantity supplied of
a good.
c. fact that ration coupons are needed to alleviate wartime shortages of goods.
d. tendency of supply and demand to shift in opposite directions.
Supply and Demand: Theory 88
Exhibit C-14
P3
P2
P1
Q1 Q2 Q3
D
S
Quantity of Good X
0
For questions 106-114, refer to Exhibit 3-14 above.
106. Refer to Exhibit 3-14. If price P1 is a price ceiling, then
a. there is a surplus in this market.
b. the highest price that can be charged legally in this market is P3.
c. the price at which exchange legally takes place is P2.
d. the price at which exchange legally takes place is P1.
e. both a and b
107. Refer to Exhibit 3-14. If price P2 is a price ceiling, then
a. there is a shortage in this market.
b. the highest price that can legally be charged in this market is P3.
c. the price at which exchange legally takes place is P2.
d. the quantity exchanged is less than the quantity demanded.
e. all of the above
108. Refer to Exhibit 3-14. If price P3 is a price ceiling, then
a. the price ceiling is not effective.
b. the price at which exchange takes place is P3.
c. the price at which exchange takes place is P2.
d. there is a shortage in this market.
e. both a and c
Exhibit 3-14
Price of Good X
Q1 Q2 Q3
Quantity of Good X
89 Chapter 3
109. Refer to Exhibit 3-14. Price P3
a. can be an effective price ceiling.
b. can be an effective price floor.
c. is the equilibrium price.
d. is the highest price that can legally be charged in this market.
e. both a and d
110. Refer to Exhibit 3-14. Price P1
a. can be an effective price ceiling.
b. can be an effective price floor.
c. is the equilibrium price.
d. both a and c
e. none of the above
111. Refer to Exhibit 3-14. If price P1 is a price ceiling, then
a. the quantity exchanged is Q3.
b. there is a shortage in this market.
c. it is the highest price that can legally be charged in this market.
d. both b and c.
e. all of the above
112. Refer to Exhibit 3-14. If price P1 is a price floor, then
a. the quantity exchanged is Q1.
b. there is a surplus in this market.
c. it is the lowest price that can legally be charged in this market.
d. both b and c
e. all of the above
113. Refer to Exhibit 3-14. If P1 is a price ceiling, the highest price for good Y, which is tied (a tie-in
sale) to good X, is
a. P1.
b. P2.
c. P3.
d. P3 – P1.
e. P1 + P2.
114. Refer to Exhibit 3-14. If P1 is a price ceiling, the maximum (per-unit) amount buyers are willing to
pay to purchase Q1 units is
a. P1.
b. P2.
c. P3.
d. P1 + P2.
e. P3 – P1.
Supply and Demand: Theory 90
115. “Scalped” tickets to hit Broadway plays, Superbowl games and rock concerts may be sold at prices
above the ticket price because
a. at the ticket price there is a surplus of seats (or good seats).
b. at the ticket price there is a shortage of seats (or good seats).
c. people enjoy paying more than the ticket price for these tickets.
d. people want to pay more than the ticket price for these tickets.
116. Price floors
a. cause surpluses when they are effective.
b. are effective when they are above the equilibrium price.
c. cause fewer exchanges to be made.
d. both a and b
e. all of the above
Exhibit C-15
F
e
F1
Q1 Q2 Q3
Medical Fees
(dollars)
D
S
Number of Doctors
0
Equilibrium
Medical Fee
Medical Fee
Paid
For questions 117-118, refer to Exhibit 3-15 above.
117. Refer to Exhibit 3-15. In Exhibit 3-15,
a. there is a shortage of doctors at fee F1.
b. there is a surplus of doctors at fee F1.
c. Q3 doctors are employed at fee F1.
d. Q2 doctors are employed at fee F1.
e. both a and c
118. Refer to Exhibit 3-15. In Exhibit 3-15,
a. Q2 doctors are employed at fee F1.
b. Q3 doctors are employed at fee F1.
c. Q1 doctors are employed at fee F1.
d. the number of doctors employed cannot be determined.
Exhibit 3-15
Q1 Q2 Q3
Number of Doctors
91 Chapter 3
Situation 3-1
During the winter of 1973-74, a general system of wage and price
controls (including a price ceiling on gasoline) was in force in the United
States. At the beginning of 1974, some oil-producing countries imposed
an oil embargo on the West. In the spring of 1974, price controls were
abolished.
119. Refer to Situation 3-1. Before the oil embargo, the price ceiling on gasoline had no noticeable effect
on the market. What is the most likely explanation for this?
a. The equilibrium price of gasoline was close to the ceiling price.
b. Twenty years ago, the demand curve for gasoline was quite different from today’s.
c. Twenty years ago, the supply curve for gasoline was quite different from today’s.
d. The effects of price ceilings are dependent upon the benevolence of the government imposing
them.
120. Refer to Situation 3-1. An economist would predict that the oil embargo imposed in 1974 would
result in a
a. leftward shift in the supply (curve) of gasoline.
b. rightward shift in the supply (curve) of gasoline.
c. leftward shift in the demand (curve) for gasoline.
d. rightward shift in the demand (curve) for gasoline.
e. both a and d
121. Refer to Situation 3-1. If no price controls had been in place, the effect of the oil embargo on the
equilibrium price and quantity of gasoline would have been
a. an increase in both price and quantity.
b. an increase in price and a decrease in quantity.
c. a decrease in price and an increase in quantity.
d. a decrease in both price and quantity.
122. Refer to Situation 3-1. Because price controls were in effect at the time the embargo occurred, an
economist would predict that
a. the amount of dollars one would need to pay at the pump for a full tank of gasoline would
increase sharply.
b. the amount of dollars one would need to pay at the pump for a full tank of gasoline would
decline sharply.
c. long waiting lines and black markets would appear.
d. a surplus of gasoline would result.
Supply and Demand: Theory 92
123. Refer to Situation 3-1. An economist would predict that once price controls were abolished in the
spring of 1974,
a. the price of gasoline would decline sharply.
b. the surplus of gasoline would vanish.
c. the shortage of gasoline would vanish.
d. the demand for gasoline would decrease.
e. both c and d
Exhibit C-16
P1
P3
D
S
0 Q
P
P1
P3
0 Q
P
P1
P3
D
S
0 Q
P
P1
P3
0 Q
P
S
D
S
D
(1) (2)
(3) (4)
P2 P2
P2 P2
For questions 124-127, refer to Exhibit 3-16 above.
124. Refer to Exhibit 3-16. Which of the graphs best represents the market for theater tickets on the day
of the performance?
a. (1)
b. (2)
c. (3)
d. (4)
Exhibit 3-16
93 Chapter 3
125. Refer to Exhibit 3-16. If there are empty seats for a basketball game at the price P*, the situation is
best depicted on graph
a. (1), with P* = P1.
b. (2), with P* = P3.
c. (3), with P* = P2.
d. (3), with P* = P3.
e. (4), with P* = P1.
126. Refer to Exhibit 3-16. Which of the following is not true?
a. Graph (1): A price ceiling set at P2 would not be effective.
b. Graph (2): As supply increases, equilibrium price remains constant.
c. Graph (3): As demand increases, equilibrium quantity remains constant.
d. Graph (4) As supply increases, equilibrium quantity increases.
e. All of the above are true.
127. Refer to Exhibit 3-16. Which of the following is not true?
a. Graph (1): There is a shortage when price is P3.
b. Graph (2): As supply increases, equilibrium quantity remains constant.
c. Graph (3): As demand increases, equilibrium price remains constant.
d. Graph (4): As supply changes, equilibrium price stays the same.
e. All of the above are true.
128. As Jamal’s income rises, his demand for video rentals does not change. It follows that, for Jamal,
video rentals are a(n)
a. normal good.
b. inferior good.
c. neutral good.
d. substitute good.
e. complementary good.
129. In the supply-and-demand diagram of the market for peanut butter, the equilibrium point has moved
down and to the right. What could have caused this?
a. a fall in the price of peanuts
b. a rise in the price of peanuts
c. a rise in income, assuming that peanut butter is an inferior good
d. a shift in preferences toward peanut butter
e. none of the above
130. In the supply-and-demand diagram of the market for peanut butter, the equilibrium point has moved
up and to the right. What could have caused this?
a. a fall in the price of peanuts
b. a rise in the price of peanuts
c. a rise in income, assuming that peanut butter is an inferior good
d. a shift in preferences toward peanut butter
e. none of the above
Supply and Demand: Theory 94
131. Which of the following statements best represents the law of demand?
a. Price and quantity demanded are inversely related, ceteris paribus.
b. Price and quantity demanded are inversely related.
c. Price and quantity demanded are directly related, ceteris paribus.
d. Price and demand are inversely related, ceteris paribus.
e. Quantity demanded rises if price rises, ceteris paribus.
132. Jerry has $50,000 in his savings account and the average new car price is $23,000. Will Jerry buy a
new car?
a. Yes, since Jerry can afford a new car.
b. Not necessarily. Jerry has the ability to buy a new car, but we don’t know if he has the
willingness, too.
c. Yes, since Jerry’s savings is more than double the average new car price.
d. none of the above
133. __________ is the number of units that individuals are __________ to buy at a particular price
during some time period.
a. Demand; willing and able
b. Supply; willing and able
c. Quantity demanded; willing and able
d. Demand; able
e. Quantity demanded; willing
134. Demand refers to
a. how much of a good people are willing and able to buy at a particular price.
b. the different quantities of a good people are willing and able to buy at different prices.
c. the different quantities of a good people are willing and able to buy at a particular price.
d. how much of a good people are willing to buy at different prices.
e. none of the above
135. Which of the following is consistent with the law of demand?
a. People substitute higher-priced goods for higher-quality goods.
b. People substitute some higher-priced goods for other higher-priced goods.
c. People substitute lower-priced goods for higher-priced goods.
d. People substitute some lower-priced goods for other lower-priced goods.
95 Chapter 3
136. If price is on the vertical axis and quantity demanded is on the horizontal axis, why is a demand
curve downward sloping (left to right)?
a. Because a demand curve is the graphical representation of the law of demand, which specifies
an inverse relationship between price and supply, ceteris paribus.
b. Because a demand curve is the graphical representation of the law of demand, which specifies a
direct relationship between price and quantity supplied, ceteris paribus.
c. Because a demand curve is the graphical representation of the law of demand, which specifies
an inverse relationship between price and demand, ceteris paribus.
d. Because a demand curve is the graphical representation of the law of demand, which specifies a
direct relationship between price and demand, ceteris paribus.
e. Because a demand curve is the graphical representation of the law of demand, which specifies
an inverse relationship between price and quantity demanded, ceteris paribus.
137. In the market for good X there are three buyers, Adam, Bill, and Carolyn. Adam buys 3 units of
good X at $4, Bill buys 7 units of good X at $4, and Carolyn buys 8 units of good X at $5. A point
on the market demand curve consists of the following price-quantity combination:
a. $4, 10
b. $4, 18
c. $4, 15
d. $5, 8
e. none of the above
138. Which of the following statements is true?
a. Demand is different than quantity demanded.
b. A demand schedule is the numerical representation of the law of demand.
c. A demand curve is the graphical representation of the direct relationship between price and
quantity demanded.
d. a and b
e. a, b, and c
139. Consider a point on a market demand curve. The point represents
a. a single price and the quantity demanded by an individual buyer.
b. a single price and the sum of the quantities demanded by all buyers.
c. various prices and various quantities demanded.
d. a single price and the quantity demanded by an individual buyer at that price and all other
prices.
e. a and c
140. If the demand for computer software rises as incomes rise, then computer software is a (an)
a. inferior good
b. substitute (good) for computers
c. normal good
d. complement (good) for computers
e. c and d
Supply and Demand: Theory 96
141. There are two universities, A and B, in a city. Tuition rises at University A and, as a result, the
demand for attending University B rises. It follows that educational services at the two universities
are
a. complements.
b. normal goods.
c. inferior goods.
d. substitutes.
e. none of the above
142. Which of the following statements is false?
a. Five factors can directly change quantity demanded: income, preferences, prices of related
goods, the number of buyers, and expectations of future price.
b. A change in (own) price changes the quantity demanded of a good.
c. A change in demand is graphically represented by a shift in the demand curve.
d. A change in quantity demanded is represented by a movement along a given demand curve.
e. Orange juice and apple juice are substitute goods if as the price of orange juice rises, the
demand for apple juice rises.
143. If potential buyers of good X expect the price of good X will soon fall, then the current
a. demand for good X will rise.
b. demand for good X will remain unchanged.
c. demand for good X will fall.
d. quantity demanded of good X will fall.
e. quantity demanded of good X will rise.
144. Which of the following statements represents a correct and sequentially accurate economic
explanation?
a. X and Y are substitutes. The price of X falls, the quantity demanded of X rises, and the demand
for Y rises.
b. X and Y are substitutes. The price of X rises, the demand for X falls, and the demand for Y
rises.
c. X and Y are substitutes. The price of X falls, the demand for X rises, and the quantity
demanded of Y rises.
d. X and Y are substitutes. The price of X falls, the quantity demanded of X rises, and the demand
for Y falls.
e. X and Y are complements. The price of X falls, the quantity demanded of X rises, and the
demand for Y falls.
97 Chapter 3
145. Which of the following statements represents a correct and sequentially accurate economic
explanation?
a. X is an inferior good and Y is a substitute for X. Income rises, the demand for X falls, the price
of X falls, and the demand for Y rises.
b. X is an inferior good and Y is a substitute for X. Income rises, the demand for X falls, the price
of X falls, and the demand for Y falls.
c. X is an inferior good and Y is a substitute for X. Income falls, the demand for X rises, the price
of X rises, and the demand for Y falls.
d. X is an inferior good and Y is a substitute for X. Income rises, the quantity demanded of X
rises, the price of X rises, and the demand for Y falls.
e. none of the above
146. In year 1 the average price of X is $10, and in year 2 the average price of X is $23. Still, consumers
buy more units of X in year 2 than in year 1. It follows that
a. the law of supply does not hold for good X.
b. demand for good X could be higher in year 2 than in year 1.
c. supply of good X could be less in year 2 than in year 1.
d. income may have been higher in year 2 than in year 1.
e. b and d
147. Which of the following statements best represents the law of supply?
a. Price and quantity supplied are inversely related.
b. Price and quantity supplied are directly related.
c. Price and quantity supplied are inversely related, ceteris paribus.
d. Price and quantity supplied are directly related, ceteris paribus.
e. Price and supply are directly related, ceteris paribus.
148. Which of the following statements is false?
a. An upward-sloping supply curve graphically represents the law of supply.
b. A vertical supply curve graphically represents the law of supply.
c. If income rises and good X is a normal good, then the demand for good X will rise.
d. If income falls and good Y is an inferior good, then the demand for good Y will rise.
e. b and d
149. A vertical supply curve represents:
a. an inverse relationship between price and quantity supplied.
b. an independent relationship between price and quantity supplied.
c. an independent relationship between price and supply.
d. a direct relationship between price and quantity supplied.
e. a direct relationship between price and supply.
Supply and Demand: Theory 98
150. The government imposes a $2.50 per-unit tax on the production of good X. As a result the
a. supply of good X falls and the price of good X rises.
b. quantity supplied of good X falls and the price of good X rises.
c. demand for good X falls and the price of good X falls.
d. supply of good X rises and the price of good X falls.
e. supply of good X falls and the price of good X falls.
151. Which of the following statements is false?
a. A change in the price of good X will usually change the quantity supplied of good X, ceteris
paribus.
b. A change in the number of sellers of a good can change the supply of that good.
c. Price and quantity supplied are directly related.
d. A vertical supply curve represents a direct relationship between price and quantity supplied.
e. a and d.
152. If a supply curve shifts rightward, this means
a. suppliers are willing and able to offer less of the good for sale at every price.
b. suppliers are willing and able to offer more of the good for sale at every price.
c. quantity supplied is greater at every price.
d. suppliers are willing and able to offer more of the good for sale only at a particular price.
e. b and c
153. If a demand curve shifts rightward, this means
a. quantity demanded is greater only at a particular price.
b. quantity demanded is greater at every price.
c. buyers are willing and able to purchase more of the good at every price.
d. buyers are willing and able to purchase less of the good at every price.
e. b and c
154. One reads the following in a newspaper: “Today the president and Congress agreed to impose new
restrictive quotas on Japanese cars coming into the country.” As a result, an economist would
predict that the
a. supply of cars in the country will remain the same and the (average) price of cars will fall.
b. supply of cars in the country will fall and the (average) price of cars will rise.
c. supply of cars in the country will rise and the (average) price of cars will fall.
d. demand for cars in the country will fall and the (average) price of cars will rise.
e. demand for cars in the country will rise and the (average) price of cars will rise.
99 Chapter 3
155. An economist says, “Technological advances have the power to lower the prices of many of the
goods we buy.” Here is how this works:
a. Technological advances lead to lower demand, which leads to lower prices.
b. Technological advances lead to greater supply, which leads to lower prices.
c. Technological advances lead to greater quantity supplied, which leads to lower prices.
d. Technological advances lead to lower taxes, which lead to greater supply, which leads to lower
prices.
e. Technological advances lead to higher taxes, which lead to fewer subsidies, which lead to
greater supply, which leads to lower prices.
156. One point on a market supply curve represents $4 and 100 units quantity supplied. If there are three
suppliers, and at a price of $4 one of the suppliers supplies 23 units, then which of the following
combinations of price and quantity supplied might hold for the other two suppliers?
a. At $4, quantity supplied could be 40 units for one supplier and 27 for the other.
b. At $4, quantity supplied could be 33 units for one supplier and 27 for the other.
c. At $4, quantity supplied could be 40 units for one supplier and 37 for the other.
d. At $4, quantity supplied could be 77 units for one supplier and 10 for the other.
e. There is not enough information to answer this question.
157. The price of X was $10 in year 1 and $14 in year 2. Which of the following could be the correct
reason for the rise in price?
a. The demand for X was higher in year 2 than in year 1, ceteris paribus.
b. The supply of X was lower in year 2 than in year 1, ceteris paribus.
c. The demand was higher, and the supply was lower, in year 2 than in year 1.
d. a and b
e. a, b, and c
158. Labor is a resource that is necessary to produce many goods. “If the price of labor falls,” says the
economist, “the prices of goods will soon follow.” How does this work?
a. If the price of labor falls, the supply of goods rises, and the prices of those goods fall.
b. If the price of labor falls, the quantity supplied of goods rises, and the prices of those goods fall.
c. If the price of labor falls, the demand for goods falls, and the prices of those goods fall.
d. If the price of labor falls, the demand for goods rises, and the prices of those goods fall.
e. If the price of labor falls, the supply of goods falls, and the prices of those goods fall.
159. One reads in the newspaper: “Today the president and Congress stiffened the requirements that
child care providers must meet before they can offer their services for sale.” As a result, an
economist would predict that
a. the supply of child care services will increase, thus lowering the price of child care services.
b. the supply of child care services will be unaffected by the stiffer requirements and therefore the
price of child care services will not change.
c. the demand for child care services will fall because people who buy child care services do not
want stiffer requirements placed on child care providers.
d. the supply of child care services will decrease, thus raising the price of child care services.
e. none of the above
Supply and Demand: Theory 100
160. If the demand for a good increases by more than the supply of the good increases, then equilibrium
price will __________ and equilibrium quantity will __________.
a. rise; fall
b. rise; rise
c. fall; fall
d. fall; rise
161. If the demand for a good falls by less than the supply of the good rises, then equilibrium price will
__________ and equilibrium quantity will __________.
a. rise; fall
b. rise; rise
c. fall; fall
d. fall; rise
162. If the demand for a good rises by more than the supply of the good falls, then equilibrium price will
__________ and equilibrium quantity will __________.
a. rise; fall
b. rise; rise
c. fall; fall
d. fall; rise
163. A change in price will lead to a change in __________ and to a change in __________, while a
change in preferences will lead to a change in __________ and a change in the prices of resources
will lead to a change in __________.
a. quantity supplied; demand; income; supply
b. demand; quantity supplied; supply; quantity demanded
c. quantity supplied; supply; quantity supplied; demand
d. quantity supplied; quantity demanded; demand; supply
e. quantity supplied; quantity demanded; supply; demand
164. The equilibrium price in market A is $24. The current price in market A is $21. At this price, there is
a. a surplus in market A.
b. a shortage in market A.
c. excess supply in market A.
d. excess demand in market A.
e. b and d
165. Jack is trying to sell his house. At the currently listed price the house has been up for sale for a year.
We can be fairly sure that
a. the currently listed price is below the equilibrium price.
b. the currently listed price is above the equilibrium price.
c. the currently listed price is the equilibrium price.
d. Jack will soon sell his house.
e. none of the above
101 Chapter 3
166. Which of the following statements is false?
a. Even at equilibrium in a market, scarcity exists.
b. If there is a shortage of 100 units at a price of $2 per unit, the shortage will be greater than 100
units at a price of $1 per unit.
c. If there is a surplus of 30 units at a price of $3, the surplus will be less than 30 units (or even
nonexistent) at a price of $2.
d. If there is a surplus, suppliers will not be able to sell all they had hoped to sell at a particular
price.
e. none of the above
167. Which set of changes will raise demand?
a. an increase in income (assuming demand is for a normal good), a decline in wage rates, and a
rise in the per-unit tax placed on the production of a good
b. an increase in the number of buyers, a decline in the price of a substitute, and an increase in the
prices of relevant resources
c. an increase in the price of a substitute, a decrease in the price of a complement, and an increase
in expected (future) price
d. a decline in the number of buyers, an increase in the price of a complement, and a decline in a
per-unit tax placed on the production of a good
e. none of the above
168. In year 1 the price of good X is $10 and 100 units are bought and sold. In year 2 the price of good X
is $13 and 230 units are bought and sold. What can explain this?
a. The supply of good X was higher in year 2 than in year 1 and the demand for good X was the
same in year 2 as in year 1.
b. The demand for good X was higher in year 2 than in year 1 and the supply of good X was the
same in year 2 as in year 1.
c. Both the demand for, and supply of, good X were higher in year 2 than year 1.
d. b or c
e. a, b, or c
169. If computers and software are complements, then
a. a fall in the price of computers will increase the demand for software and, ceteris paribus, the
price of software will rise.
b. a rise in the price of computers will decrease the demand for software and, ceteris paribus, the
price of software will rise.
c. a fall in the price of computers will decrease the demand for software and, ceteris paribus, the
price of software will fall.
d. a rise in the price of software will increase the demand for computers and, ceteris paribus, the
price of computers will rise.
e. a fall in the price of software will decrease the demand for computers and, ceteris paribus, the
price of computers will fall.
Supply and Demand: Theory 102
170. What condition is necessary before ticket scalping is possible?
a. The ticket must have originally been sold at a price less than equilibrium price.
b. The ticket must have originally been sold at a price greater than equilibrium price.
c. There has to a large demand for the ticketed event; for example, an event like the Super Bowl
or a World Series game.
d. The demand for the ticketed event necessarily must rise after tickets were originally sold at
equilibrium prices.
e. none of the above
171. A __________ is a government-mandated maximum price __________ which legal trades cannot
be made.
a. price floor; above
b. price ceiling; below
c. price ceiling; above
d. price floor; below
e. none of the above
172. Which of the following statements is true?
a. If a surplus equals 200 units at $2 above equilibrium price, then a shortage must equal 200 units
at $2 below equilibrium price.
b. Shortages create price ceilings.
c. Surpluses create price floors.
d. b and c
e. none of the above
173. If the current market price is below equilibrium
a. it must be because the government has imposed a price ceiling.
b. there is a shortage of the product.
c. there is a surplus of the product.
d. demand must necessarily decrease to restore equilibrium.
e. a and b
174. If the price of good X is $40 and the price of good Y is $30, it follows that the relative price of one
unit of good X is
a. 1.00 unit of Y.
b. 2.00 units of Y.
c. 0.75 units of Y.
d. 1.33 units of Y.
e. $30.
103 Chapter 3
175. If the price of good X is $100 and the price of good Y is $20, it follows that the relative price of one
unit of good Y is
a. 5.00 units of X.
b. 0.20 unit of X.
c. 2.00 units of X.
d. 4.00 units of X.
e. There is not enough information to answer the question.
176. If the price of good X is $40 and the price of good Y is $30, it follows that the relative price of one
unit of good Y is
a. 1.00 unit of X.
b. 1.33 units of X.
c. 0.75 unit of X.
d. 2.00 units of X.
e. There is not enough information to answer the question.
177. Which of the following is a false statement?
a. The law of marginal utility states that for a given time period, the marginal utility or satisfaction
gained by consuming equal successive units of a good will increase as the amount consumed
increases.
b. The inverse relationship between price and quantity demanded is partly explained by the law of
diminishing marginal utility.
c. If the absolute price of good X rises, ceteris paribus, then it follows that the relative price of
good X rises.
d. a and c
178. Which of the following is descriptive of the law of diminishing marginal utility?
a. The third hamburger tastes differently than the first hamburger.
b. The third hamburger is priced higher than the first hamburger.
c. As price falls, quantity demanded rises, ceteris paribus.
d. Things get more expensive as costs rise.
e. none of the above
179. Economists state that the __________ utility a person receives from a unit of a good, the
__________ price he or she is willing to pay for it. This statement is based on the law of
__________.
a. more, lower, demand
b. more, higher, diminishing marginal utility
c. less, higher, supply
d. less, lower, demand
e. a and d
Supply and Demand: Theory 104
180. There are two goods in the economy, apples and bread. The relative price of apples has increased.
This could be due to
a. an increase in the absolute price of apples, ceteris paribus.
b. a decrease in the absolute price of bread, ceteris paribus.
c. a decrease in the absolute price of apples, ceteris paribus.
d. an increase in the absolute price of bread, ceteris paribus.
e. a and b
181. The law of demand states that there is an inverse relationship between price and quantity
demanded, ceteris paribus. The “price” that is being referred to is:
a. relative price.
b. absolute price.
c. both relative price and absolute price since ceteris paribus is specified.
d. neither relative price nor absolute price since ceteris paribus is specified.
e. none of the above
182. If the absolute price of a car is $40,000 and the relative price of a computer in terms of cars is 1/10
of a car, it follows that the absolute price of a computer is
a. $10,000
b. $1,000
c. $4,000
d. $2,000
e. There is not enough information to answer the question.
183. If the absolute price of a computer is $2,000 and the relative price of a dining room table is 4
computers, it follows that the absolute price of a dining room table is
a. $10,000
b. $500
c. $8,000
d. $12,000
e. none of the above
184. If the relative price of one unit of good X is 5 units of good Y, then it follows that the absolute price
of good X can be __________ and the absolute price of good Y can be __________.
a. $20,000; $10,000
b. $40,000; $8,000
c. $30,000; $5,0000
d. $5,000; $40,000
e. a and c
105 Chapter 3
185. If the relative price of one unit of good Y is 0.25 units of good Z, then it follows that the absolute
price of good Z can be __________ and the absolute price of good Y can be __________.
a. $4,000; $2,000
b. $1,000; $2,000
c. $2,000; $1,000
d. a and c
e. none of the above
Supply and Demand: Theory 106
True/False
1. When the price of a Honda Civic rises, ceteris paribus, the demand for Civics falls.
2. In order for a price floor to be effective it must be set below the equilibrium price.
3. A surplus will occur in a market when the price of the product is above the equilibrium price.
4. Supply curves are always upward sloping.
5. If the government increased licensing requirements for beauty salons, the supply curve for salon
services would shift to the left.
6. Economists use the terms neutral good and normal good interchangeably.
7. An increase in demand means the same thing as an increase in quantity demanded.
8. In moving along a demand curve, everything is held constant except the prices of related goods.
9. A demand curve is the graphical representation of the law of demand.
10. A shortage in the bread market can cause the price of bread to rise.
11. The law of diminishing marginal utility helps to explain the direct relationship between price and
quantity supplied.
12. Another term for excess supply is shortage.
13. A simultaneous decrease in demand and supply always leads to a decrease in price.
14. Both consumers’ surplus and producers’ surplus are maximized at equilibrium.
15. If hot dogs are an inferior good, a decrease in income will cause the equilibrium price of hot dogs to
rise.
107 Chapter 3
16. Scarcity and shortage are synonyms.
Essay
1. Explain the difference between a change in supply and a change in quantity supplied. Be sure to state
what causes each to change and how they differ when graphed.
2. What condition is necessary for a price ceiling to be effective? What effects will an effective price
ceiling have on a market?
3. The prices for personal computers have fallen over the past few years, yet the computer companies
have offered more and more of them for sale. Does this mean that the supply curve for computers is
downward sloping? Explain.
4. Explain how having a knowledge of supply and demand can be useful.
5. Eighty percent of all navel oranges grown in the US come from California. In the winter of 1998 a
series of storms in California damaged about 70% of the navel orange crop.
[Show More]


 (1).png)