Management > QUESTIONS & ANSWERS > Questions and Answers > University of North Texas - MGMT 3830Lecture Notes, Chapters 1 & 2 Into (All)
Questions and Answers > University of North Texas - MGMT 3830Lecture Notes, Chapters 1 & 2 Into and Competitiveness, Strategy and Productivity
Document Content and Description Below
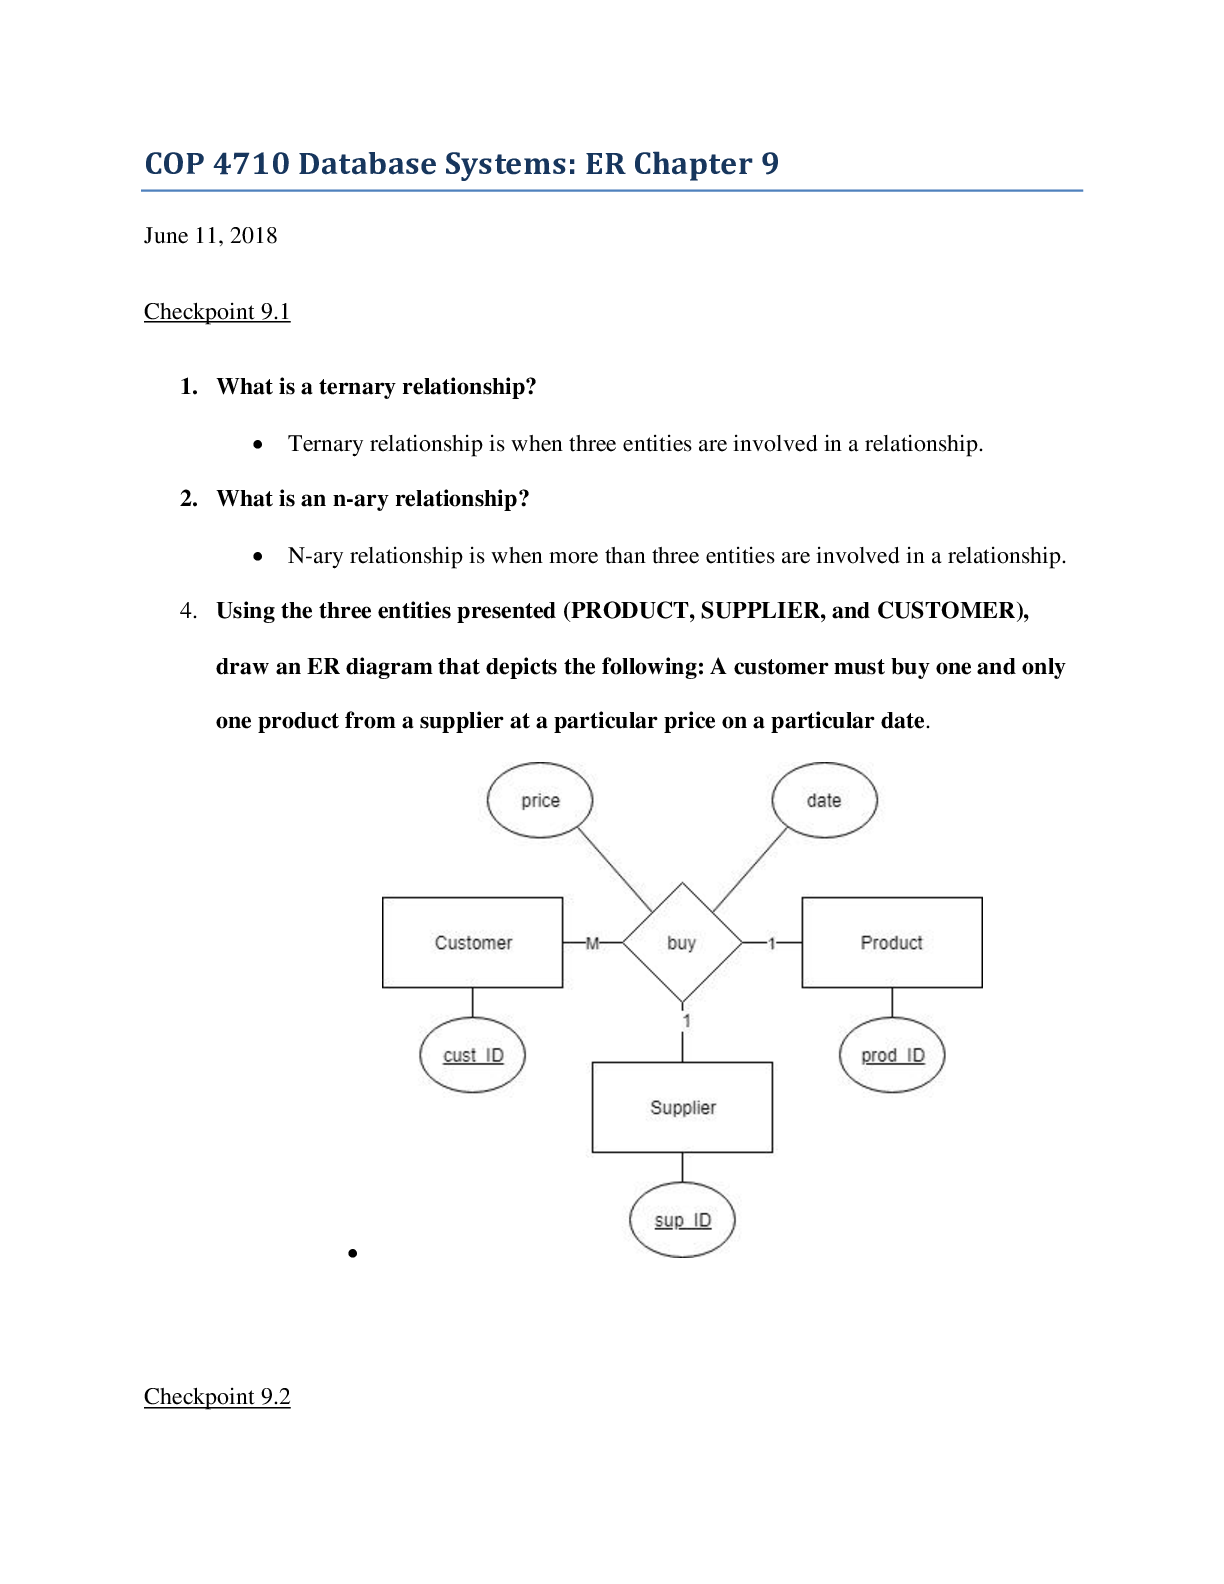
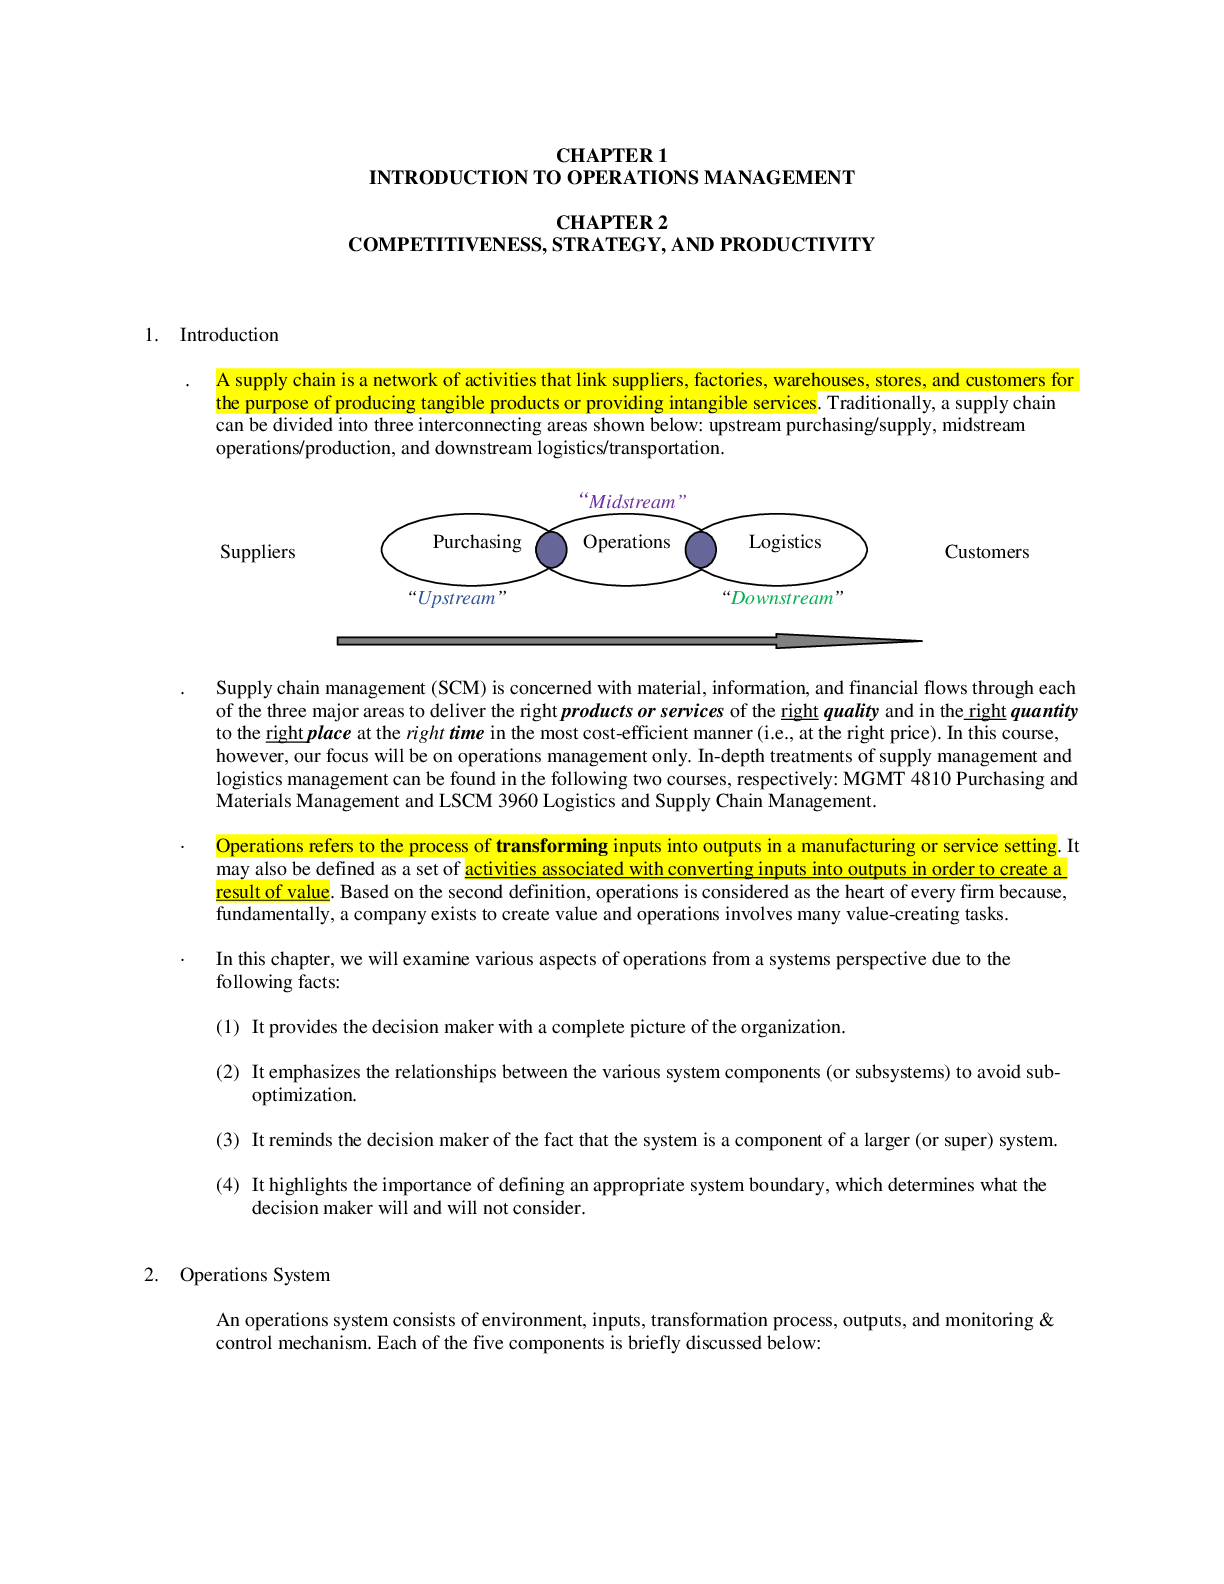
Questions and Answers > University of North Texas - MGMT 3830Lecture Notes, Chapters 1 & 2 Into and Competitiveness, Strategy and Productivity CHAPTER 1 INTRODUCTION TO OPERATIONS MANAGEMENT CH... APTER 2 COMPETITIVENESS, STRATEGY, AND PRODUCTIVITY Introduction . A supply chain is a network of activities that link suppliers, factories, warehouses, stores, and customers for the purpose of producing tangible products or providing intangible services. Traditionally, a supply chain can be divided into three interconnecting areas shown below: upstream purchasing/supply, midstream operations/production, and downstream logistics/transportation. “Midstream” Suppliers | Customers “Upstream” | “Downstream”Suppliers . Supply chain management (SCM) is concerned with material, information, and financial flows through each of the three major areas to deliver the right products or services of the right quality and in the right quantity to the right place at the right time in the most cost-efficient manner (i.e., at the right price). In this course, however, our focus will be on operations management only. In-depth treatments of supply management and logistics management can be found in the following two courses, respectively: MGMT 4810 Purchasing and Materials Management and LSCM 3960 Logistics and Supply Chain Management. · Operations refers to the process of transforming inputs into outputs in a manufacturing or service setting. It may also be defined as a set of activities associated with converting inputs into outputs in order to create a result of value. Based on the second definition, operations is considered as the heart of every firm because, fundamentally, a company exists to create value and operations involves many value-creating tasks. · | In this chapter, we will examine various aspects of operations from a systems perspective due to the following facts:(1) It provides the decision maker with a complete picture of the organization. (2) It emphasizes the relationships between the various system components (or subsystems) to avoid suboptimization. (3) It reminds the decision maker of the fact that the system is a component of a larger (or super) system. (4) It highlights the importance of defining an appropriate system boundary, which determines what the decision maker will and will not consider. Example 1&2.1: If the healthcare process in a hospital is considered as an operations system, what would the appropriate inputs to and outputs from the system be? –What goes into hospital and what comes out as the outcome. Example 1&2.2: Name one possible interaction between operations and each of the following two business functions: (1) research and development (R & D); (2) quality control. Example of Inputs / Outputs: inputs might include manpower, buildings, machines, materials, energy, capital, overhead, etc. and outputs might be finished products, cured patients, new knowledge, etc. · Productivity can be measured in a number of different ways as follows: Task (e.g., typing) Department (e.g., painting) Scope Company (e.g., Boeing) Industry (e.g., electronics) Productivity | Country (e.g., U.S.) Partial-factor (= Total outputs/Single input) Multi-factor (= Total output/Subset of inputs) Total (= Total outputs/Total inputs) | Basis . | Example 1&2.3: J & C Chemicals in Tacoma, WA, makes water purification crystals for swimming pools. The major inputs used in the production process and the amount of output for each of the last two years are listed below: Year | 2012 | 2013 ------------------------------------------------------------------------------ Output Crystal (dollars/pound) | 12 | 16 Crystal (pounds) Inputs Labor (hours) | Labor cost (dollars) | Energy (kws) Energy cost (dollars) Raw materials (pounds) Raw material cost (dollars) | -------------------------------------------------------------------------- (1) What was the partial-factor productivity of raw material in pounds per dollar in 2012? (2) What was the partial-factor productivity of labor in dollars per hour in 2013? (3) What was the multi-factor productivity of non-labor inputs in pounds per dollar in 2012? (4) What was the total productivity in dollars per dollar in 2012? (5) What was the total productivity in dollars per dollar in 2013? (6) Based on your findings in (4) and (5) above, was J & C more productive in 2012 or 2013 and why? [Show More]
Last updated: 2 years ago
Preview 1 out of 5 pages
Buy this document to get the full access instantly
Instant Download Access after purchase
Buy NowInstant download
We Accept:

Reviews( 0 )
$12.00
Can't find what you want? Try our AI powered Search
Document information
Connected school, study & course
About the document
Uploaded On
Feb 24, 2021
Number of pages
5
Written in

Additional information
This document has been written for:
Uploaded
Feb 24, 2021
Downloads
0
Views
112


.png)
.png)
.png)
.png)
.png)
.png)
.png)