Applied-Algebra Exam Practice Questions
This Applied-Algebra exam PDF provides detailed practice questions, answers,
and explanations. These WGU Applied-Algebra exam practice questions are
designed for IT professional
...
Applied-Algebra Exam Practice Questions
This Applied-Algebra exam PDF provides detailed practice questions, answers,
and explanations. These WGU Applied-Algebra exam practice questions are
designed for IT professionals, system administrators, and students preparing for
Courses and Certificates certification.
Key Features
Exam-Oriented Questions: Realistic practice questions that mirror the format
and difficulty of actual certification exams.
Wide Coverage: Includes cloud computing, networking, security, AI, and
enterprise IT management exams.
Study-Friendly Format: Organized sections by exam type, enabling focused
preparation.
Important Note:
This material is for personal study purposes only. Please do not
redistribute or use for commercial purposes without permission.
Share some Applied-Algebra exam online questions below.
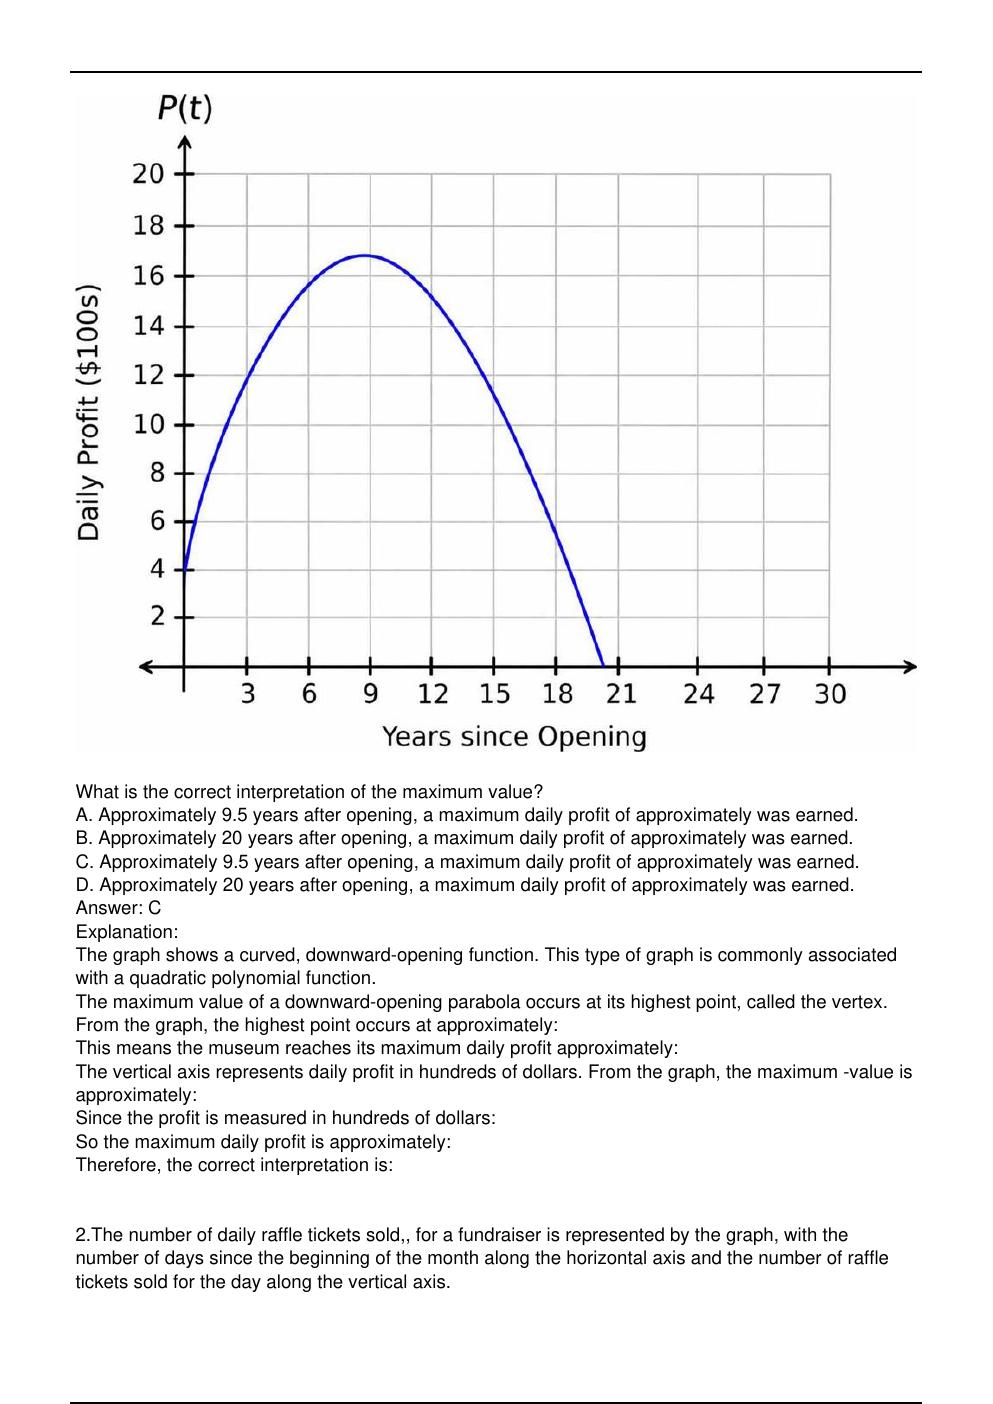
1.The function represents the daily profit, in hundreds of dollars, for a museum since opening.
The graph of is shown.
What is the correct interpretation of the maximum value?
A. Approximately 9.5 years after opening, a maximum daily profit of approximately was earned.
B. Approximately 20 years after opening, a maximum daily profit of approximately was earned.
C. Approximately 9.5 years after opening, a maximum daily profit of approximately was earned.
D. Approximately 20 years after opening, a maximum daily profit of approximately was earned.
Answer: C
Explanation:
The graph shows a curved, downward-opening function. This type of graph is commonly associated
with a quadratic polynomial function.
The maximum value of a downward-opening parabola occurs at its highest point, called the vertex.
From the graph, the highest point occurs at approximately:
This means the museum reaches its maximum daily profit approximately:
The vertical axis represents daily profit in hundreds of dollars. From the graph, the maximum -value is
approximately:
Since the profit is measured in hundreds of dollars:
So the maximum daily profit is approximately:
Therefore, the correct interpretation is:
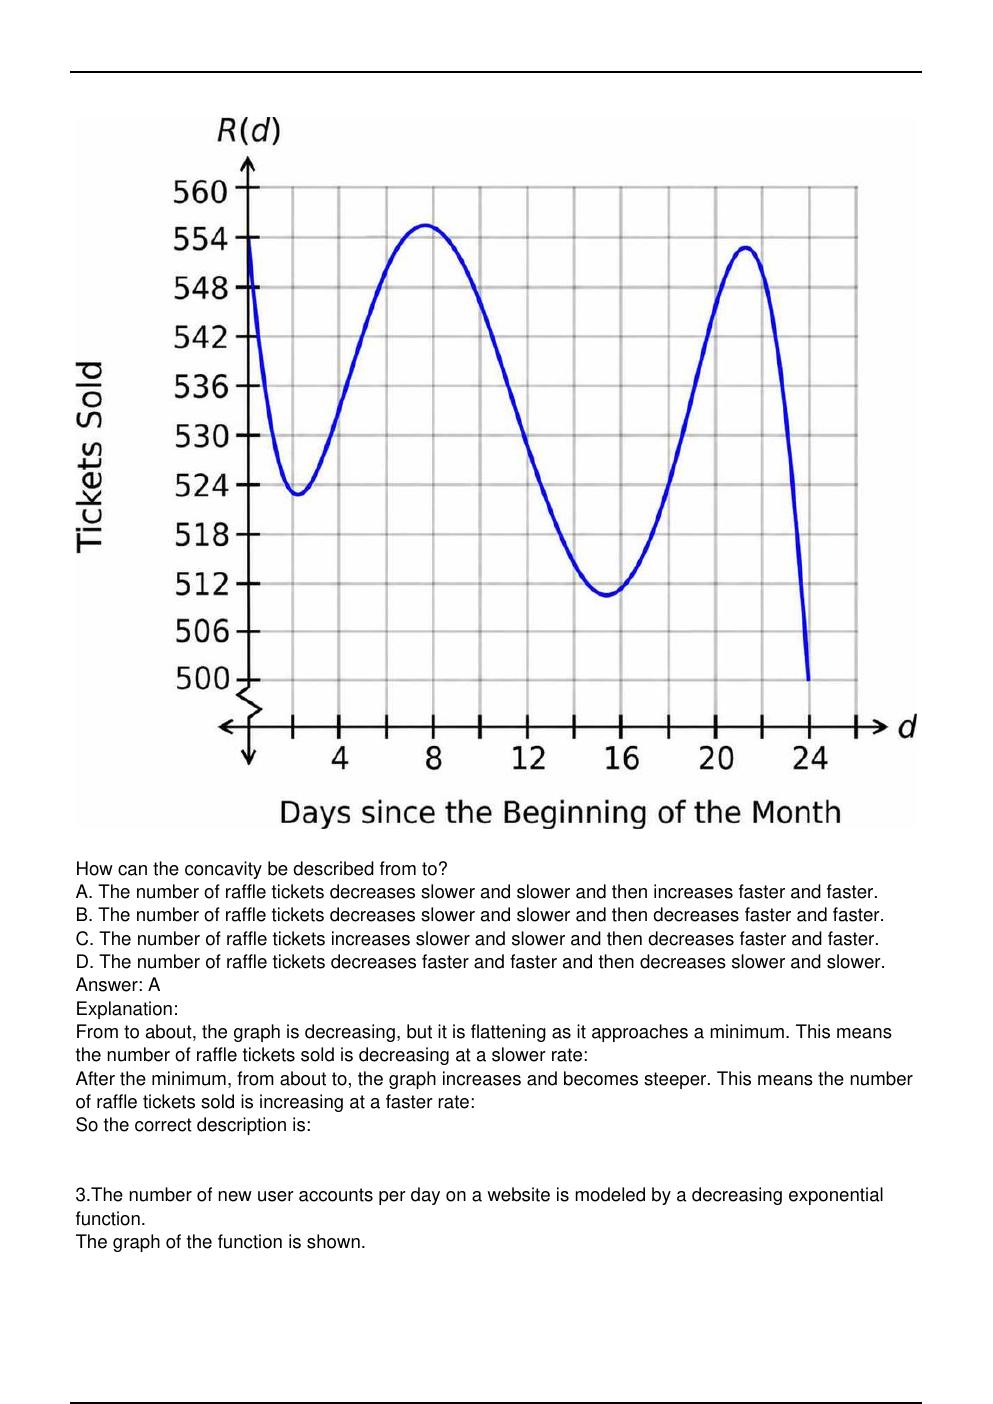
2.The number of daily raffle tickets sold,, for a fundraiser is represented by the graph, with the
number of days since the beginning of the month along the horizontal axis and the number of raffle
tickets sold for the day along the vertical axis.
How can the concavity be described from to?
A. The number of raffle tickets decreases slower and slower and then increases faster and faster.
B. The number of raffle tickets decreases slower and slower and then decreases faster and faster.
C. The number of raffle tickets increases slower and slower and then decreases faster and faster.
D. The number of raffle tickets decreases faster and faster and then decreases slower and slower.
Answer: A
Explanation:
From to about, the graph is decreasing, but it is flattening as it approaches a minimum. This means
the number of raffle tickets sold is decreasing at a slower rate:
After the minimum, from about to, the graph increases and becomes steeper. This means the number
of raffle tickets sold is increasing at a faster rate:
So the correct description is:
3.The number of new user accounts per day on a website is modeled by a decreasing exponential
function.
The graph of the function is shown.
Which statement is justified considering the location of the horizontal asymptote?
A. The number of daily new user accounts will change by a constant rate over time.
B. The greatest number of daily new user accounts occurs after 10 months.
C. The number of daily new user accounts will not decrease to 0.
D. The number of daily new user accounts changes the most after the first 5 months.
Answer: C
Explanation:
The graph shows a decreasing exponential function.
The horizontal axis represents:
The vertical axis represents:
The graph starts near new user accounts per day and decreases over time. However, it does not
decrease toward.
Instead, the graph levels off near a horizontal value around:
This horizontal value is the horizontal asymptote.
A horizontal asymptote shows the long-term value the function approaches. Since the asymptote is
above, the model predicts that the number of daily new user accounts approaches a positive value,
not zero.
So the justified statement is:
4.The logistic function, whose graph is shown, models the number of registrants for an academic
conference, where represents the number of weeks since registration opened and represents the
number of registrants.
[Show More]












![Preview of eBook [PDF] Advanced Technologies for Rechargeable Batteries Metal Ion, Hybrid, and Metal-](https://browseimages.nyc3.digitaloceanspaces.com/paper-images/2024/Aug/31/4CeOA98s2024-08-31-08-3766d2ac249f11f.png)
![Preview of eBook [PDF] Digital Personality A Man Forever Volume 2 Technical Aspects 1st Edition By Ku](https://browseimages.nyc3.digitaloceanspaces.com/paper-images/2024/Aug/30/t3vEGYrg2024-08-30-02-3166d1adaa38427.png)